Fig. 3.

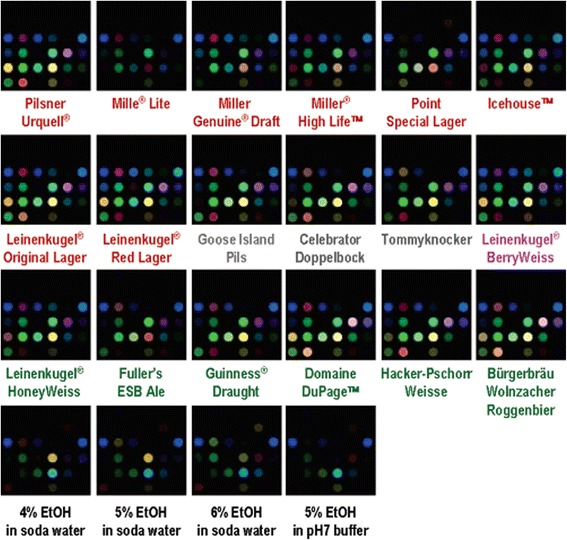
Average color-change profiles of 18 commercial beers and 4 control ethanol solutions for gas-phase analysis. The names are coded with different colors: red, American and Czech lagers; gray, German lagers; green, ales; magenta, specialty; and black, control. For the purposes of an effective visualization, the color range that is shown in these representations is expanded from the RGB values of 4–35 (i.e., 5 bit) to 0–255 (i.e., 8 bit). Color change profiles were obtained from by treatment of sensor arrays with gas-phases of 18 beers. Each beer showed the unique color change profile and these strong responses from beers did not come from ethanol, humidity, or CO2. Principal component analysis (PCA) and hierarchical clustering analysis (HCA) were performed for the visual representation of high-dimensional data obtained from color change profiles. Reprinted from [68] with permission from ACS Publications)
