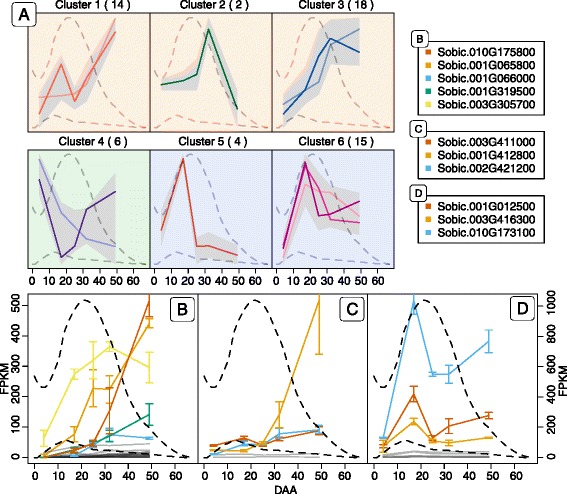
Fig. 7.

Expression profiles of GSTs in the course of sorghum grain development. All 59 expressed GSTs found in the phylogenetic analysis were normalized to Z-score and clustered using hierarchical clustering with Wards method (a). The hierarchical clustering was divided into 6 groups, which was further subdivided into 12 subgroups (colored lines in each cluster) (Additional file 6). The lighter colored line represents the first subgroup and the darker colored line the last subgroup in a cluster. The number of genes in each cluster is listed in parenthesis next to the cluster number. The grey field represents the span of all the expression profiles in a single cluster. The dashed lines represent the concentration of dhurrin (largest peak between day 10 and 20) and pGlcPAAc through grain development in relation to the expression profiles of the different GSTs. Glutathionylating GSTs from cluster 1–3 plotted in FPKM (b). Deglutathionylating GSTs from cluster 1–3 plotted in FPKM (c). GST identified by Hayes et al. (2015) along with similar genes in similar cluster group 6 (d). Highly expressed genes in panel b–d have colored lines referring to the genes listed next to panel a. Gray lines are genes only expressed at low abundance
