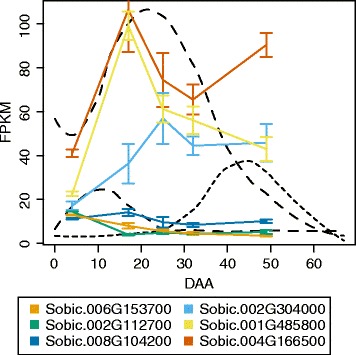
Fig. 8.

Expression profiles of the sorghum nitrilase superfamily genes in the course of grain development. The expression profiles of the six nitrilase superfamily genes expressed in the course of grain development shown in FPKM. The colors of the profiles corresponds to the gene names listed in the box below the plot. The three dashed curves represent dhurrin (tallest dashed curve), dhurrin amide (left-most dashed curve) and dhurrin amide (right-most dashed curve). The NIT4 genes are excluded from this figure, but shown in Figs. 5 and 11
