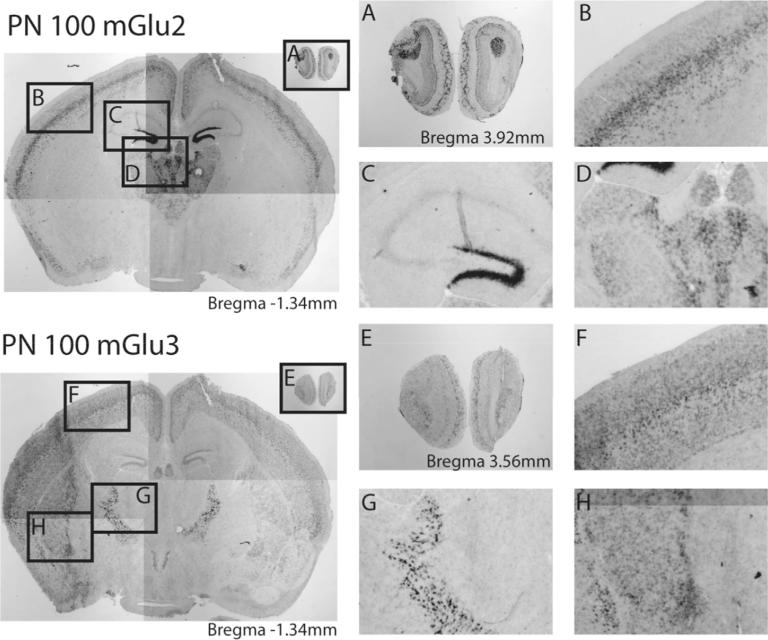
Fig. 2.
Distinct patterns of mGlu2 and mGlu3 in the adult mouse brain. Representative images of different brain subregions expressing mGlu2 and mGlu3 mRNA at postnatal day 100 (PN100). High magnification panels correspond to outlined borders on low magnification map as indicated for mGlu2 (A–D) and mGlu3 (E–H). Distinct expression of mGlu2 and mGlu3 is seen in the olfactory bulb (A and E), cortical layers (B and F), and subcortical nuclei (D, H). mGlu2 is enriched in the dentate gyrus of the hippocampus (C), whereas high levels of mGlu3 are seen in the reticular thalamic nucleus (G).

