Figure 3.
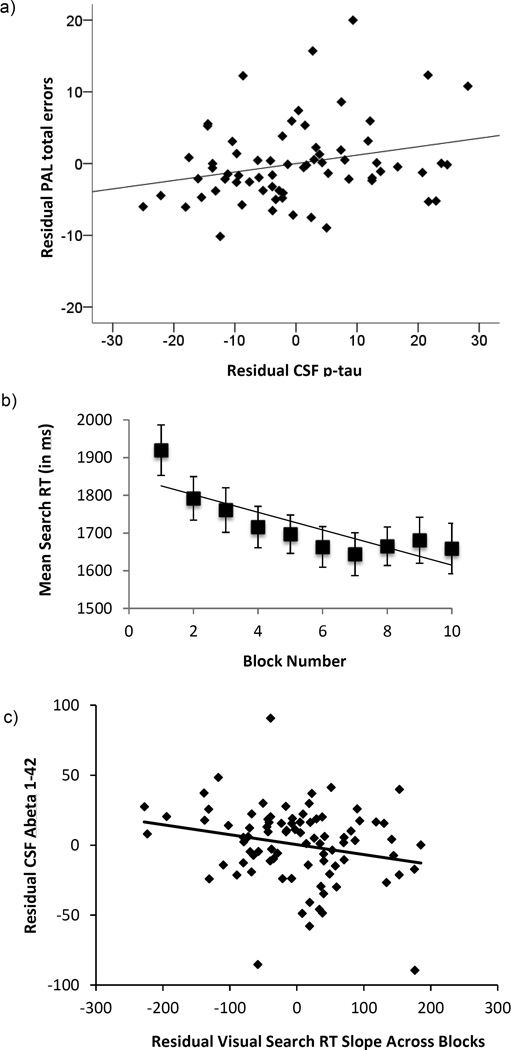
Top panel (a): Scatterplot showing the partial correlation between CSF p-tau levels approximately 10 years prior to testing and the total number of errors on the Paired Associates Learning (PAL) task (adjusted for age and diagnosis at test). Middle panel (b): Mean visual search RT (and standard error) across the 10 blocks of the task. The line represents the mean slope across blocks. Bottom panel (c): Scatterplot showing partial correlation between CSF Aβ1-42 approximately 10 years prior to testing and visual search learning (i.e., slope across block, adjusted for age and diagnosis at test).

