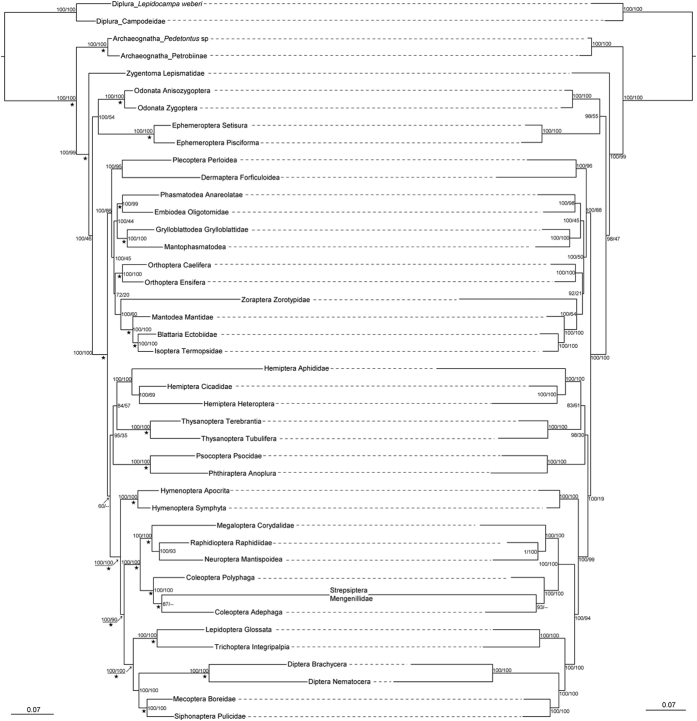
Figure 2. Phylograms inferred from the nuclear genes.
The left tree is based on the five nuclear genes with DNA model applied to the paired sites of rDNAs, while the right tree is based on the five nuclear genes with Doublet model applied to the paired sites of rRNAs. Numbers associated with each node indicate Bayesian posterior probabilities values and maximum-likelihood (ML) bootstrap values. An asterisk denotes that the clade is also present in the maximum parsimony analysis (only values ≥60% are shown). A dash is shown if the topology is not shown in the maximum likelihood analysis. The lengths of the branches follow the phylograms of the BI trees.

