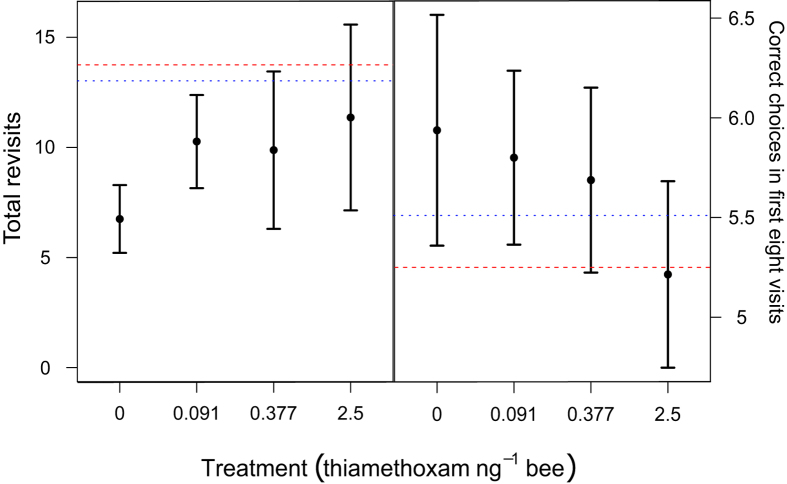
Figure 3. Total revisits and correct choices in the first eight visits on the radial-arm maze following acute pesticide exposure.
Mean (a) total revisits and (b) correct choices in the first eight visits with 95% confidence intervals for bees treated with one of four pesticide treatments: 0 ng per bee (control, n = 16), 0.091 ng per bee (LD.091, n = 14), 0.377 ng per bee (LD.377, n = 16) and 2.5 ng per bee (high, n = 15). Horizontal lines indicate simulated performance when bees behave at random (red dashed) and using stereotypical behaviour only (blue dots).

