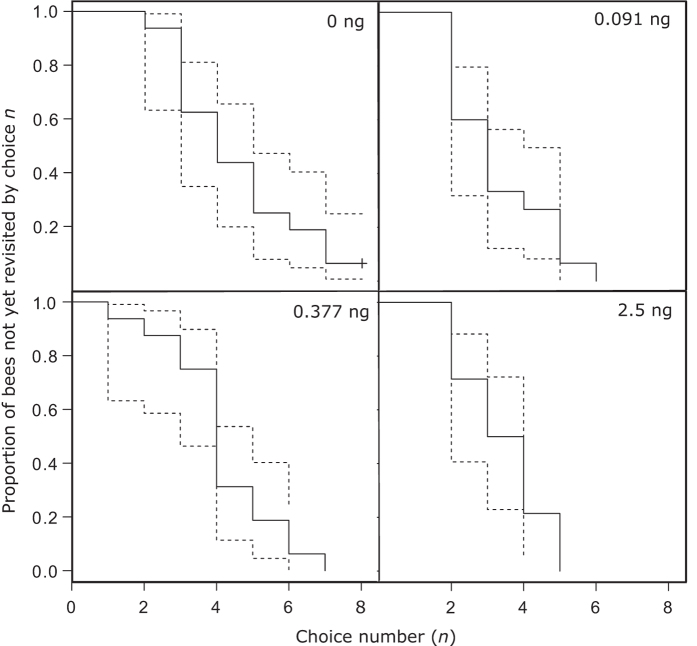
Figure 5. Kaplan-Meier curves of choices before first revisit for four pesticide treatments.
Each step represents the choice at which a bee or bees made their first revisit; for example, all bees in the high group made a revisit by choice five, while all but one bee in the control group made a revisit by choice eight. Dashed lines indicate standard errors.

