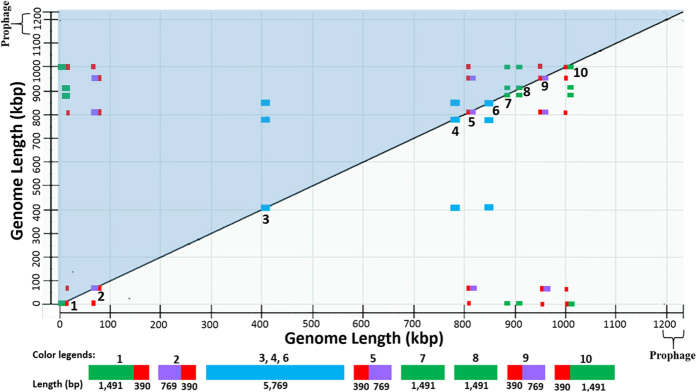
Figure 1. Visualization of repeat regions in the genome sequence of “Candidatus Liberibacter asiaticus” (CLas) strain A4 (CP010804).
The dot-matrix map was created by self-comparison through BLAST program available in National Center for Biotechnological Information. Genome length was marked in both X- and Y-axis with the prophage region identified. The upper-left diagonal (in blue shadow) shares the same information as the bottom-right diagonal. Examination on one diagonal (e.g. the bottom-right) reveals ten repeat regions on the diagonal line labeled with numbers accordingly. Sequences sharing >99.9% similarities (repeats) among the ten regions are marked with the same color. The red color sequence (390 bp) has the higher copy number of five (Region 1, 2, 5, 9, and10). Region 3, 4, and 6 are rrn operon in blue.

