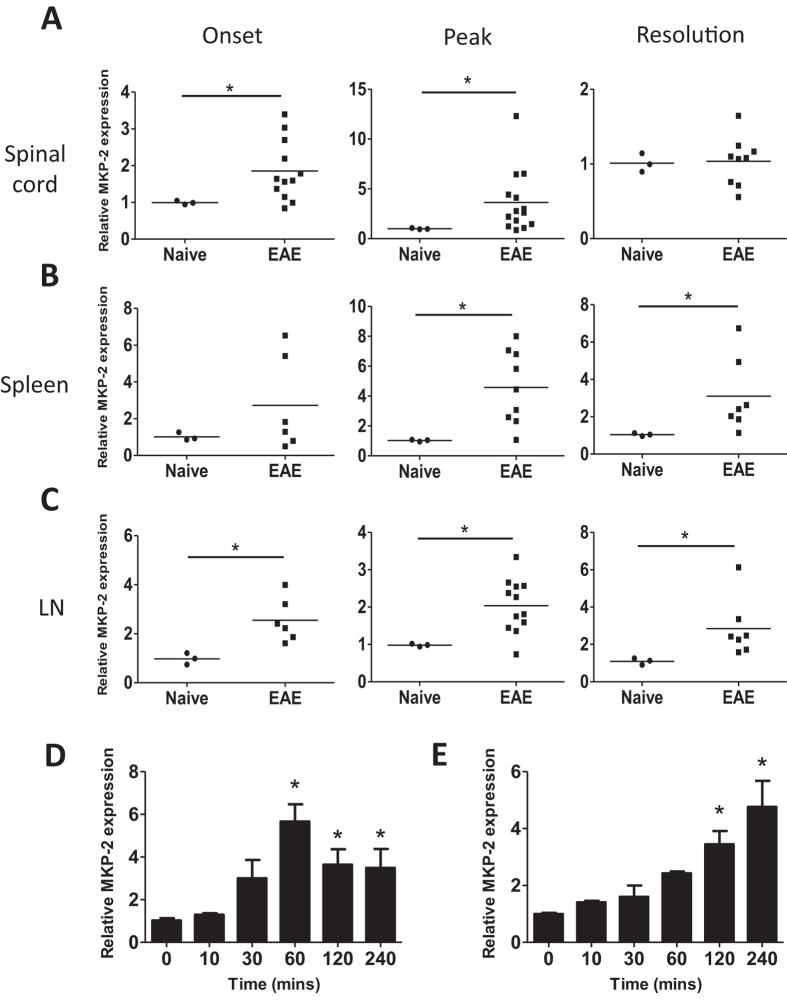
Figure 1. MKP-2 mRNA expression is increased in tissues of EAE mice.
(A) Spinal cord, (B) spleen and (C) dLN tissues were harvested from naïve C57BL/6 mice or at EAE onset, peak and resolution stages of MOG35-55 immunised mice. RNA was isolated and reverse transcribed to allow analysis of MKP-2 mRNA expression by quantitative PCR. (D) Spleen and (E) dLN tissues were harvested from EAE peak mice and single cell suspensions prepared and cultured with or without MOG35-55 for the times indicated. Cells were then harvested for analysis of MKP-2 mRNA expression by quantitative PCR. Results show changes in MKP-2 mRNA expression relative to naïve tissue or unstimulated cells using the 2-ΔΔCT method. (A–C) Each symbol represents an individual mouse and bar indicates the average value of relative MKP-2 expression in each group. (D–E) Graphs show data from two independent experiments, n = 8. *P < 0.05.

