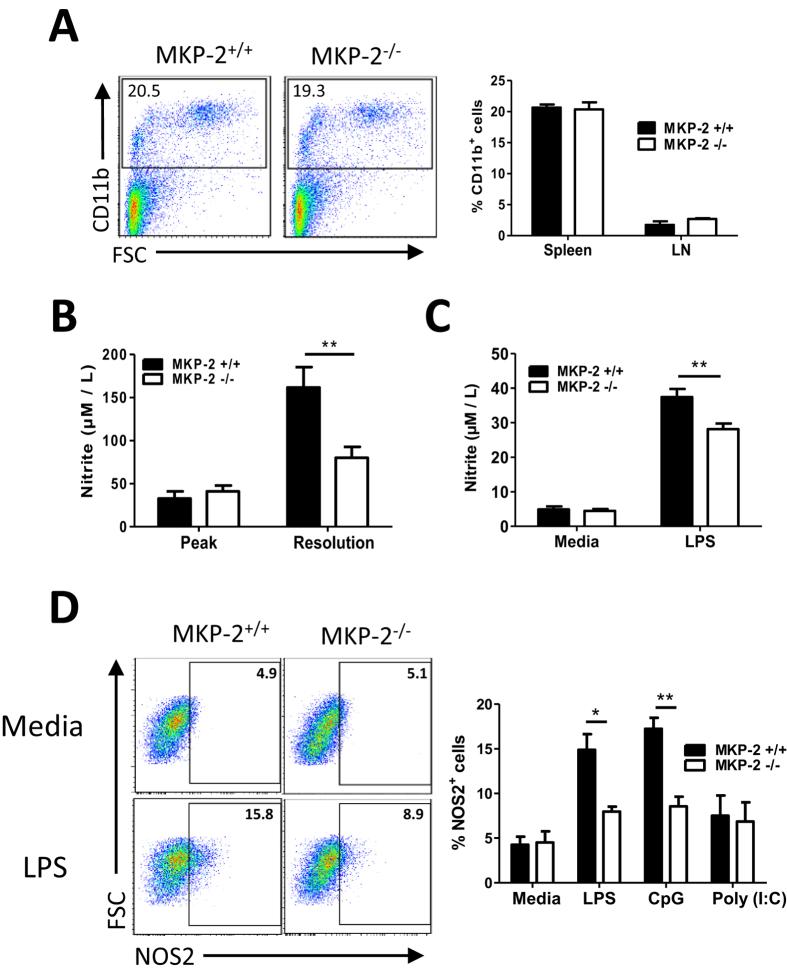
Figure 7. MKP-2 is important for NO production by macrophages.
(A) Spleen and dLNs were harvested at EAE peak and disrupted to form individual cell suspensions and cells stained for CD11b expression. FACS plots are representative of at least 9 mice per group from three independent experiments. Graphs show combined data from three independent experiments, bars represent mean ± SEM. (B) Whole blood was harvested at EAE peak and resolution stages and nitrite concentrations determined by Griess Assay. Graphs show mean ± SEM of two independent experiments (n = 7 MKP-2+/+; n = 8 MKP-2−/−). (C) BMMs were generated from the bone marrow from MKP-2+/+ and MKP-2−/− mice. Cells were stimulated with or without LPS (100 ng/ml) and culture supernatant was collected after 24 hours and nitrite concentrations determined by Griess Assay. Values represent mean ± SEM of three independent experiments. (D) BMMs were stimulated with or without LPS (100 ng/ml), CpG (1 μM) or Poly(I:C) (20 μg/ml) for 24 hours and NOS2 expression was analysed by flow cytometry following initial gating on CD11b+ cells. FACS plots are representative of three independent experiments of BMMs either unstimulated or activated by LPS. Graphs show combined data from three independent experiments, bars represent mean ± SEM. *P < 0.05, **P < 0.01.

