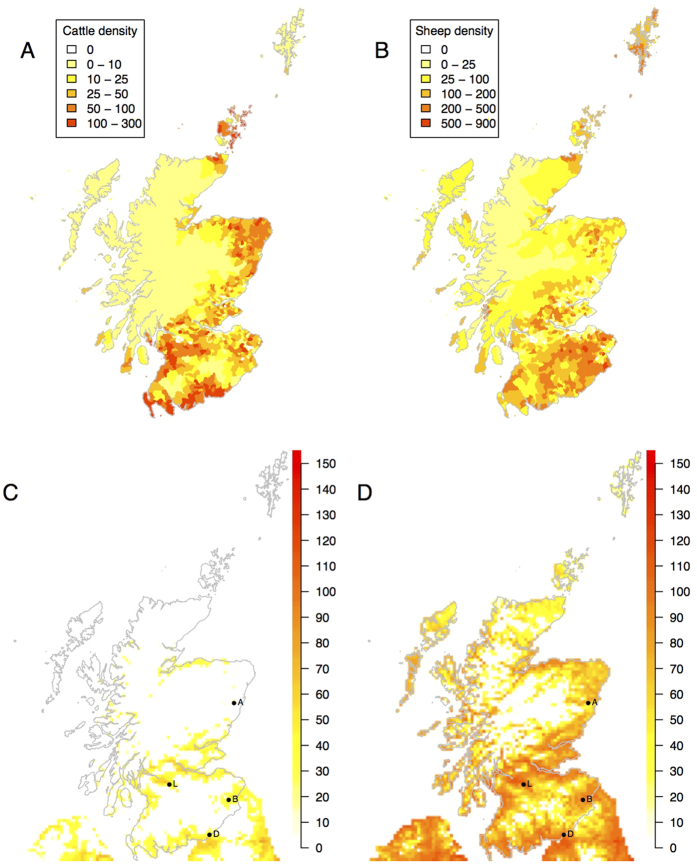
Figure 2.
Density of cattle per km2 (A) and density of sheep per km2 (B) plotted by parish. The baseline (C) and worst case (D) scenario for BT in terms of potential for spread showing the number of days with an R0 greater than 1. Locations of the seeds are the black points. Maps created using R45.

