
Figure 3. TAC induced ascending aortic inflammatory changes without and with losartan treatment.
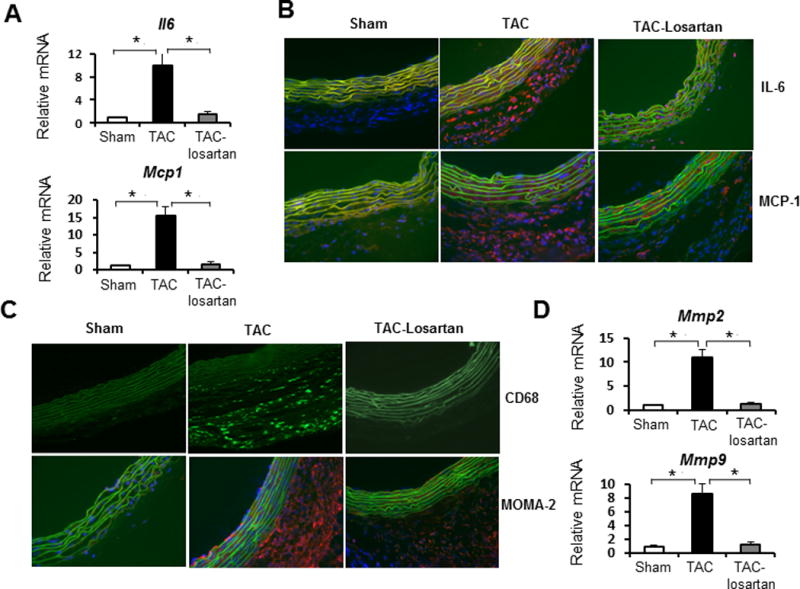
A. Q-PCR analysis of IL-6 and Mcp-1 expression in ascending aortic tissues from sham-operated (white bars), TAC for 2 weeks (black bars) and TAC mice treated with losartan for 2 weeks (grey bar). Gene expression levels were normalized to Gapdh. n = 5 per group, *, P<0.05. B and C. Immunofluorescence staining for IL-6, MCP-1(B); macrophage marker CD68 and MOMA-2 (C). Transverse cryosections (7 μm) of ascending aorta were prepared from sham-operated mice, TAC mice for 2 weeks and TAC mice treated with losartan for 2 weeks. Nuclei were stained with DAPI (blue). Elastic lamellae of the media are green (autofluorescence). Positive staining is red (Texas red-conjugated secondary antibody). Original magnification: 400X. D. Q-PCR analysis of expression levels of Mmp2 and Mmp9 in ascending aortic tissues from sham-operated (white bars), TAC mice (black bars), and TAC mice treated with losartan for 2 weeks (grey bar). Gene expression levels were normalized to Gapdh. n = 5 per group. *, P<0.05.