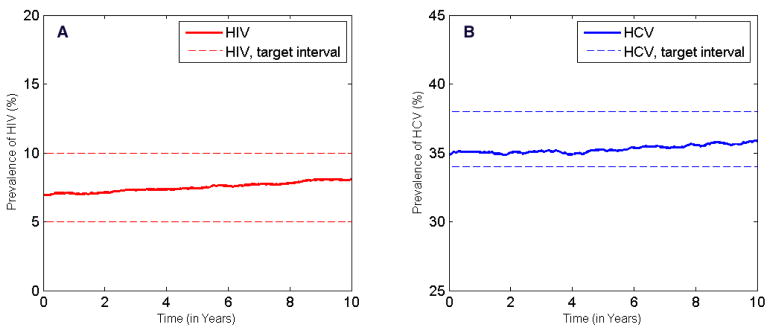
Figure 2.
Results of calibration. A: Across the US, HIV prevalence in the IDU population remained relatively constant around 7% for the past decade [31, 32, 33]. We assumed this trend would carry into the next 10 years and defined a target interval of 5–10% HIV prevalence. After calibration, the projection of HIV prevalence simulated by our model (averaged over 100 runs) lies within the target interval. B: HCV prevalence in the IDU population in the US increased slightly in the past decade [34]; thus we assumed an increasing trend in the future and defined a target interval of 34–38% HCV prevalence. The simulated HCV prevalence (averaged over 100 runs) falls within the target interval.

