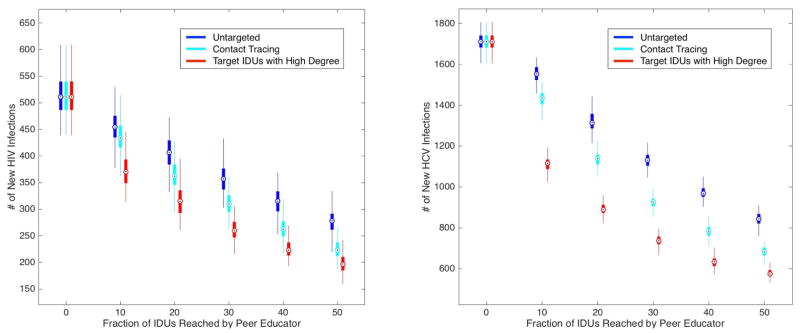
Figure 3.
Number of new HIV infections and new HCV infections over 10 simulated years for a peer education (PE) program that promotes condom use and discourages needle-sharing. Quartiles of the 100 simulation runs are indicated with the Tukey boxplot. We compare three scenarios: 1) untargeted PE (dark blue boxes) in which peer educators reach random IDUs in the population; 2) PE in which IDUs are identified for enrollment via contact tracing (light blue boxes); 3) targeted PE (red boxes) in which peer educators reach IDUs with the greatest number of partners (both sexual and needle-sharing).

