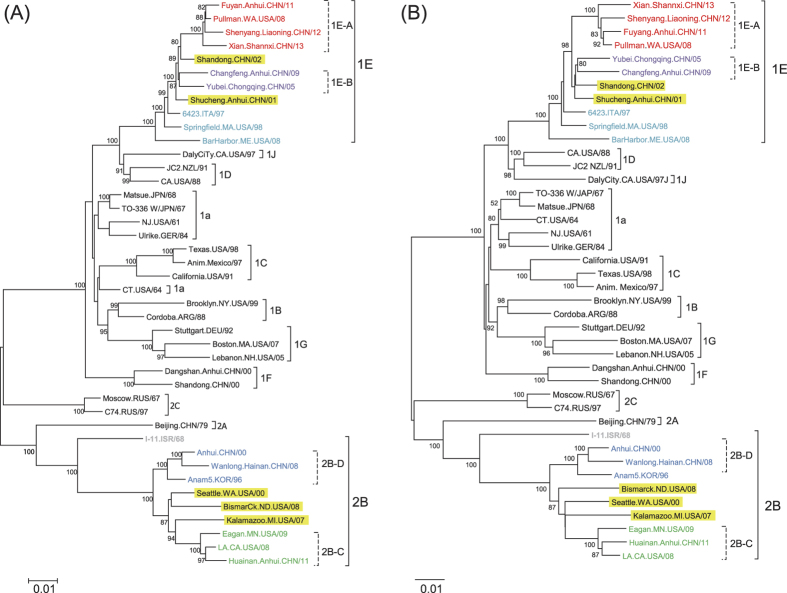
Figure 1.
Phylogenetic tree of 42 RVs based on complete genomic sequences with maximum likelihood with Tamura-Nei model (A) or neighbor-joining method with Kimura 2-parameter model (B) by MEGA6. Clusters in 1E and 2B are color-coded and the outliers in 1E and 2B are highlighted. The percentage of replicate trees in which the associated genotypes/clusters were found by the bootstrap test (1000 replicates) are shown next to the branches. The distances were computed using the p-distance method and are in the units of the number of base differences per site. The tree is drawn to the scale shown at the bottom of the figure, with branch lengths measured in the number of substitutions per site. Each sequence is given an abbreviated name which is shown in Supplemental Table 1.

