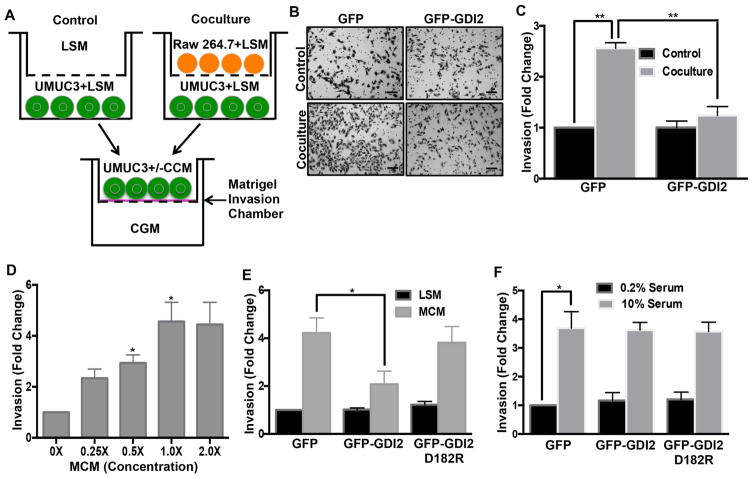
Figure 1. RhoGDI2 regulates macrophage-conditioned medium induced invasion of bladder cancer cells.
(A) 1×10⁵ UMUC3 cells were co-cultured with 3×10⁵ Raw 264.7 cells for 18 hr; these “conditioned” UMUC3 cells were then seeded in matrigel invasion chambers in co-culture conditioned medium (CCM) and invasion analyzed after 7 hr. (B) Representative images of cells on the underside of the filter (scale bar, 100 μm) (C) Quantification of matrigel invasion. Values are mean ± SEM, fold change relative to control, n=3, **p < 0.01. (D) 4×10⁴ UMUC3 were analyzed for invasion through matrigel for 18 hr with the indicated final concentration of macrophage-conditioned medium (MCM). Quantification of invasion from 5 different fields as in (C); n=3, *p < 0.05. (E) UMUC3 cells stably expressing GFP, WT GFP-RhoGDI2 or the D182R mutant were assayed for matrigel invasion in low serum medium (LSM: 0.2% FBS) or macrophage-conditioned medium and quantified as in (C). n=4; *p < 0.05. (F) UMUC3 cell stably expressing GFP, WT GFP-RhoGDI2 or the D182R mutant were assayed for matrigel invasion either in low (0.2% FBS) or high serum medium (10.0% FBS) for 22h. Quantified as in (C). n=3; *p < 0.05. See also Figure S1.

