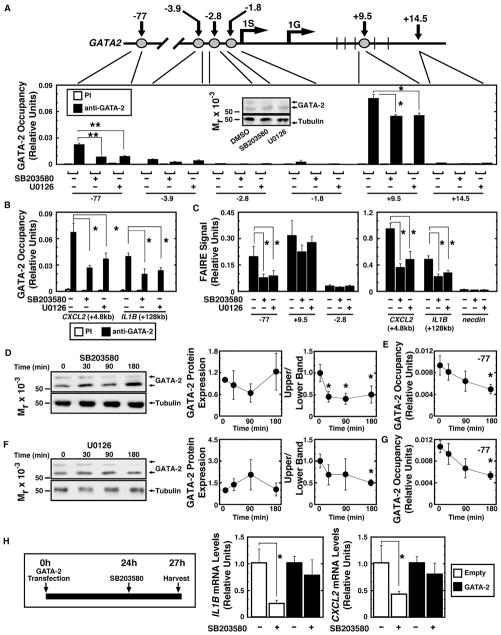
Figure 3. p38/ERK Signaling Promotes GATA-2 Chromatin Occupancy and Chromatin Remodeling.
(A) Gata2 locus map. Numbers represent distance to mouse 1S transcription start site. 1G is another GATA2 transcription start site. Quantitative ChIP analysis of GATA-2 occupancy in Kasumi-1 cells treated with 40 μM SB203580 or 20 μM U0126 is shown (n = 4, mean ± SE, *p < 0.05 and **p < 0.01). The western blot (anti-GATA-2 antibody) (inset) illustrates GATA-2 expression in representative samples used for ChIP.
(B) Quantitative ChIP analysis of GATA-2 occupancy at GATA-2 target genes in Kasumi-1 cells treated with 40 μM SB203580 or 20 μM U0126 is shown (n = 4, mean ± SE, *p < 0.05).
(C) Quantitative FAIRE analysis of chromatin accessibility in Kasumi-1 cells treated with 40 μM SB203580 or 20 μM U0126 is shown (n = 4, mean ± SE, *p < 0.05 and **p < 0.01).
(D) Kinetics of GATA-2 expression and phosphorylation are shown (n = 3, mean ± SE, *p < 0.05).
(E) GATA-2 occupancy at the −77 kb site during 40 μM SB203580 treatment is shown (n = 3, mean ± SE, *p < 0.05).
(F) Kinetics of GATA-2 protein expression and phosphorylation are shown (n = 3, mean ± SE, *p < 0.05).
(G) GATA-2 occupancy at the −77 kb site during 20 μM U0126 treatment is shown (n = 3, mean ± SE, *p < 0.05).
(H) Left: rescue assay. Right: qRT-PCR analysis of IL1B and CXCL2 in Kasumi-1 cells expressing GATA-2 or control vector with or without 10 μM SB203580 is shown (n = 4; mean ± SE; *p < 0.05; PI, preimmune).
See also Figure S3.

