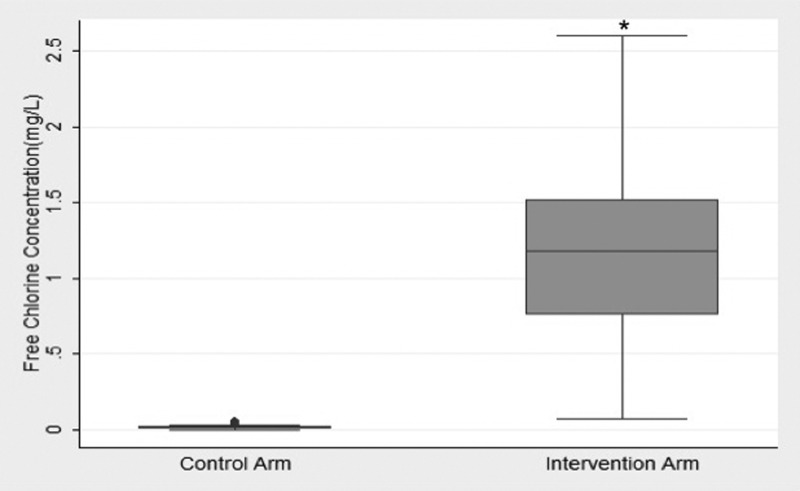
Figure 2.
The baseline (Day 1) mean free chlorine concentration was 0.175 mg/L and 0.171 mg/L in control and intervention household stored water, respectively (P = 0.81). During the intervention period, the free chlorine concentration was significantly higher (P = 0.001) in the intervention arm (1.12 mg/L) compared with the control (0.0176 mg/L). * P = 0.001.

