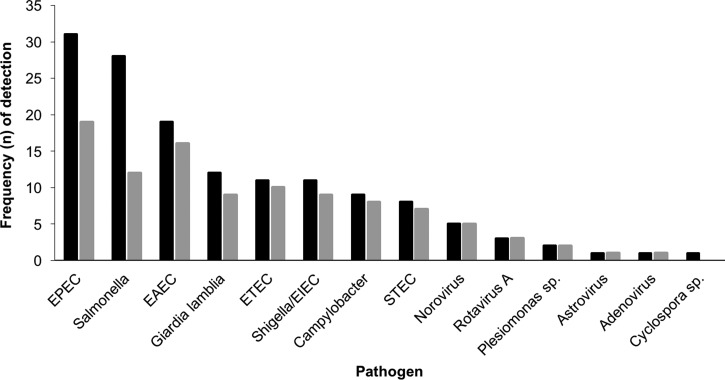
Figure 1.
Frequency of detection and co-detection of potential pathogens among study subjects. Legend: Black bars represent total frequency of detection for each pathogen and grey bars represent frequency of co-detection in which one or more other pathogens were detected in the same stool sample. EAEC = enteroaggregative E. coli; EIEC = enteroinvasive E. coli; EPEC = enteropathogenic E. coli; ETEC = enterotoxigenic E. coli; STEC = Shiga-like toxin-producing E. coli.

