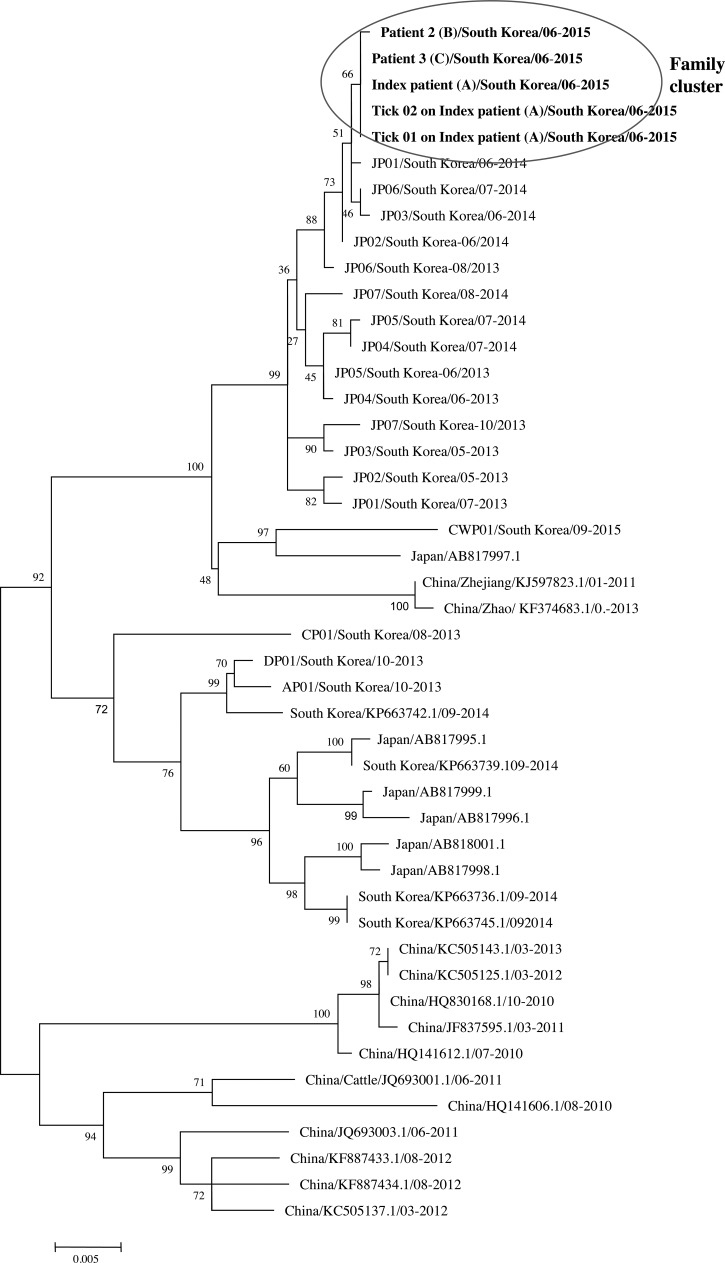
Figure 2.
Phylogenetic tree constructed based on the S segment. The tree was constructed using the maximum likelihood method with MEGA 6.12 The S sequences of the family cluster and ticks in this study are shown in bold. Index patient/South Korea/06-2015 was amplified from the index patient (A), patient 2/South Korea/06-2015 was amplified from patient 2 (B), and patient 3/South Korea/06-2015 was amplified from patient 3 (C) in June 2015. Tick 01 on index patient/South Korea/06-2015 was amplified from a tick on the index patient, and Tick 02 on index patient/South Korea/06-2015 was also amplified a from tick on the index patient. The S sequence data for the viruses identified in China, South Korea, and Japan were obtained from NCBI/BLAST.

