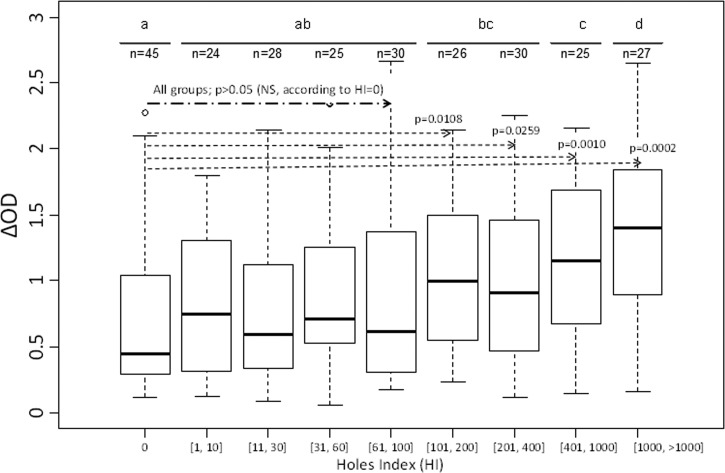
Figure 1.
IgG levels to gSG6-P1 salivary peptide according to HI groups. Box plots show anti-gSG6-P1 IgG level (ΔOD) of the different HI groups. The box plots display the median ΔOD value, 25th and 75th percentiles. The dots indicate the outliers, and horizontal bars indicate the median value for each group. Differences between the two groups were tested by using the nonparametric Mann–Whitney U test. HI = hole index; OD = optical density.

