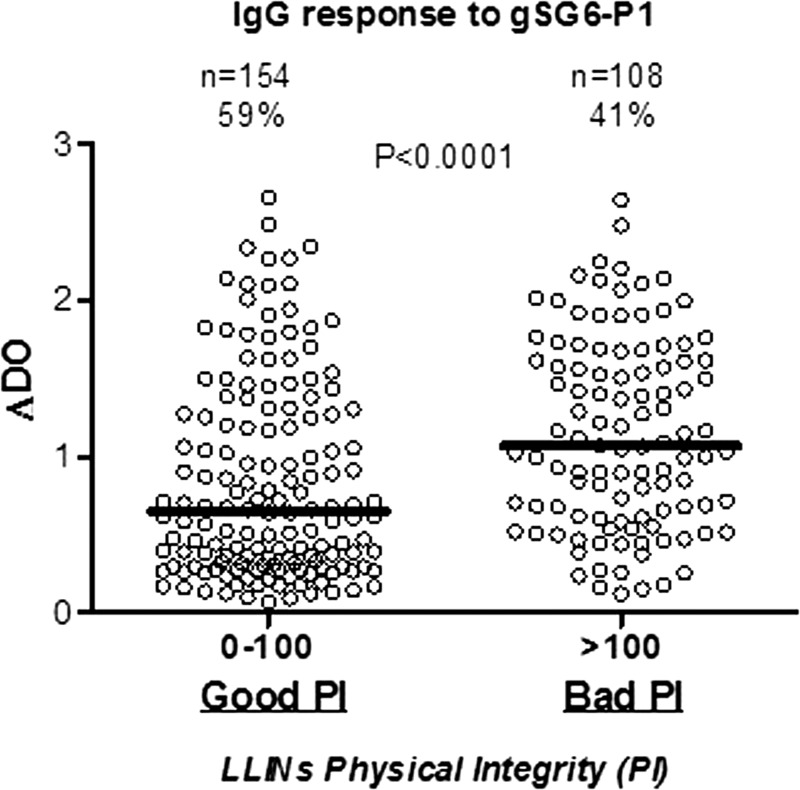
Figure 2.
IgG levels to gSG6-P1 peptide of individuals sleeping under LLINs classified as “Good PI” or “Bad PI.” PI was assessed through HI value associated to 0–100 and > 100 ranges, respectively, for the two status “Good PI” and “Bad PI.” Individual specific IgG level (ΔOD) results are shown for the two groups, and horizontal bars indicate the median value for each PI groups. Statistical significant differences are indicated according to the P value (nonparametric Mann–Whitney U test). HI = hole index; LLINs = long-lasting insecticidal nets; OD = optical density; PI = physical integrity.

