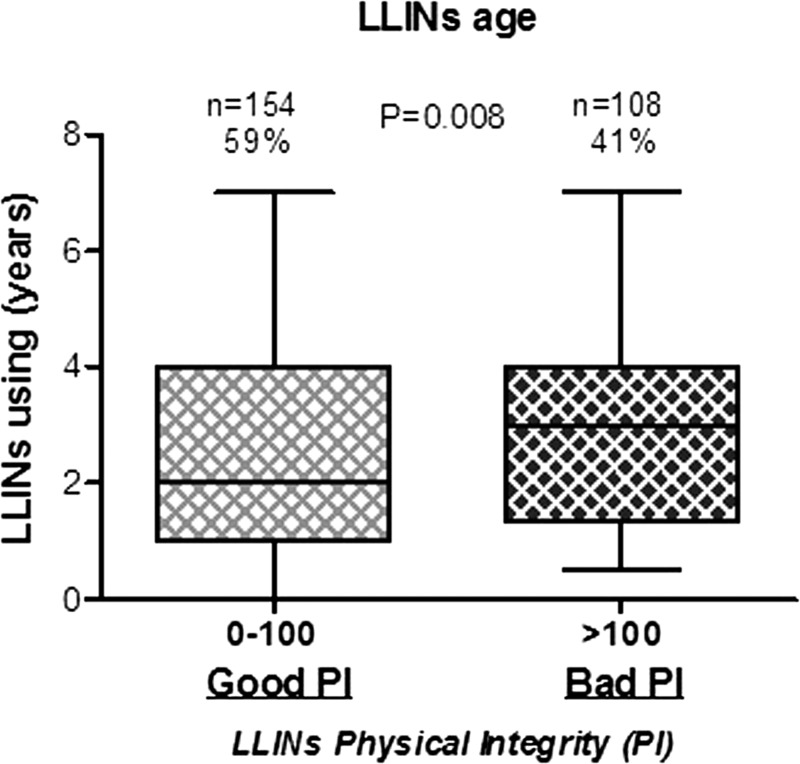
Figure 3.
Age of LLINs according to the two defined groups of LLIN PI. Box plots show LLINs age in the two different HI groups associated to 0–100 and > 100 ranges for the two status “Good PI” (light gray) and “Bad PI” (black box), respectively. Horizontal lines in the boxes indicate the median LLIN age value. Boxes display 25th and 75th percentiles. The difference between the two groups was tested by using the nonparametric Mann–Whitney U test. HI = hole index; LLINs = long-lasting insecticidal nets; OD = optical density; PI = physical integrity.

