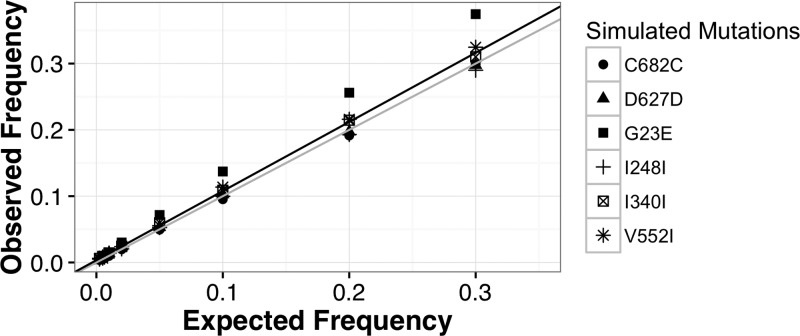
Figure 2.
Detection of simulated minor allele frequency (MAF) using the revised Minor Allele Catcher (rMAC) pipeline. Reads were simulated with mutations that matched our observed single-nucleotide polymorphisms (Table 1) at frequencies of 30%, 20%, 10%, 5%, 2%, 1%, 0.5%, and 0.25%, respectively. Polymerase chain reaction (PCR) error was simulated using an in-house script that incorporated the effects of starting template amount and polymerase error rates. It propagates polymerase errors such that early round errors appear at a higher frequency than errors in latter rounds. PCR-simulated sequences were then fragmented with read length distribution similar to patient samples and processed with 454Sim to incorporate sequencing errors similar to Ion Torrent sequencing. The scatter plot shows a distribution of the observed simulated frequencies calculated by the rMAC (observed frequency) vs. the eight expected MAFs ranging from 0.25% to 30% (expected frequency). A line of ideal fit (y = 1x + 0; colored gray) and a linear regressed line of best fit (y = 1.04x + 0.003, r2 = 0.98; colored black) are overlain on the plot. Simulations were run with 11,745–191,130 starting template copies, depending on the pooled sample and a polymerase error rate of 3.5 × 10⁻⁶.

