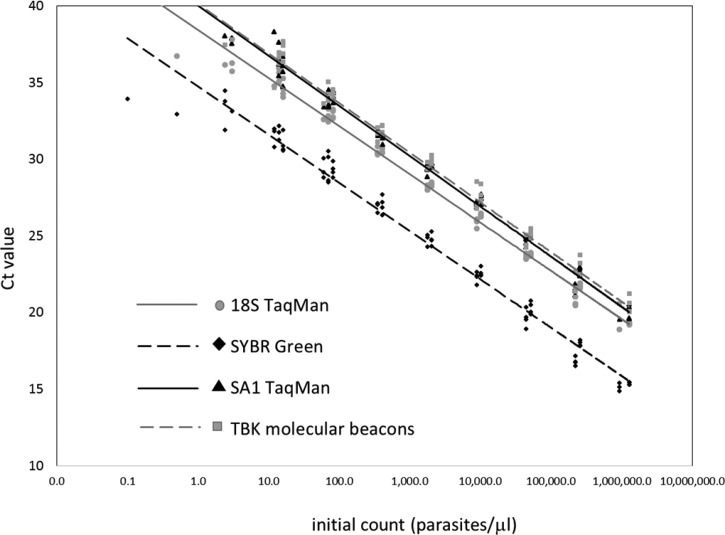
Figure 1.
Standard curves based on serial dilutions of blood samples with calculated parasitemia from experimentally infected hamsters. The Ct values obtained from each dilution were plotted against the initial parasite count. The data points: 18S rRNA assay, gray circles; SYBR Green assay, black diamonds; SA1 TaqMan assay, black triangles; and TBK assay, gray squares. Logarithmic trend lines were calculated for each real-time PCR assay: 18S rRNA assay, solid gray line; SYBR Green assay, dashed black line; SA1 TaqMan assay, solid black line; and TBK assay, dashed gray line.

