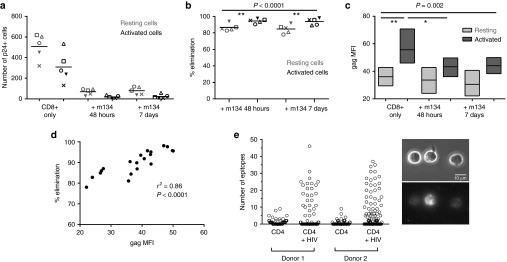
Figure 6.
ImmTAV-mediated elimination of activated and resting HIV-infected CD4+ T-cells. Purified PHA-stimulated CD4+ T-cells from the same five HLA-A*0201-positive ART-treated patients as in Figure 5 were cultured with healthy donor CD8+ T-cells alone or with ImmTAV m134 (10–8 mol/l). The ImmTAV was either present for the duration of coculture or washed out after 48 hours. (a) The number of activated (CD25+/CD69+/HLA-DR+) and resting (CD25-/CD69-/HLA-DR-) Gag+ CD4+ T-cells remaining on day 7 of coculture and (b) percent elimination of infected cells, normalized to CD8-only values, within each subset is shown. (c) Mean fluorescence intensity (MFI, arbitrary units) of Gag expression in residual infected activated and resting CD4+ T-cells after culture under the conditions indicated (as for a and b; bars and horizontal lines represent range and mean respectively). Consistency in MFI values was ensured by acquiring all samples in a single run. (d). Correlation between Gag MFI (arbitrary units) and normalized percent elimination of infected cells. (e) Biotinylated m134 ImmTAV was detected by microscopy on the surface of individual HIV-1 IIIB-infected CD4+ T-cells from two healthy donors after staining with streptavidin-PE. Data shown in left panel represent counts of fluorescent spots; the total for each cell was obtained using Z-stack images. Uninfected cells were used to determine background staining. Right panel: representative phase-contrast (top) and corresponding fluorescence images (bottom) of infected CD4+ T-cells from donor 1 stained with m134 ImmTAV. Fluorescence images are 3D reconstructions of individual planes. The brightness/contrast of images was adjusted to optimize epitope visualization. The scale bar represents 10 µm. HLA, human histocompatibility leukocyte antigen; PHA, phytohemagglutinin; HIV, human immunodeficiency virus; ImmTAV, immune-mobilising monoclonal T-cell receptors against virus.

