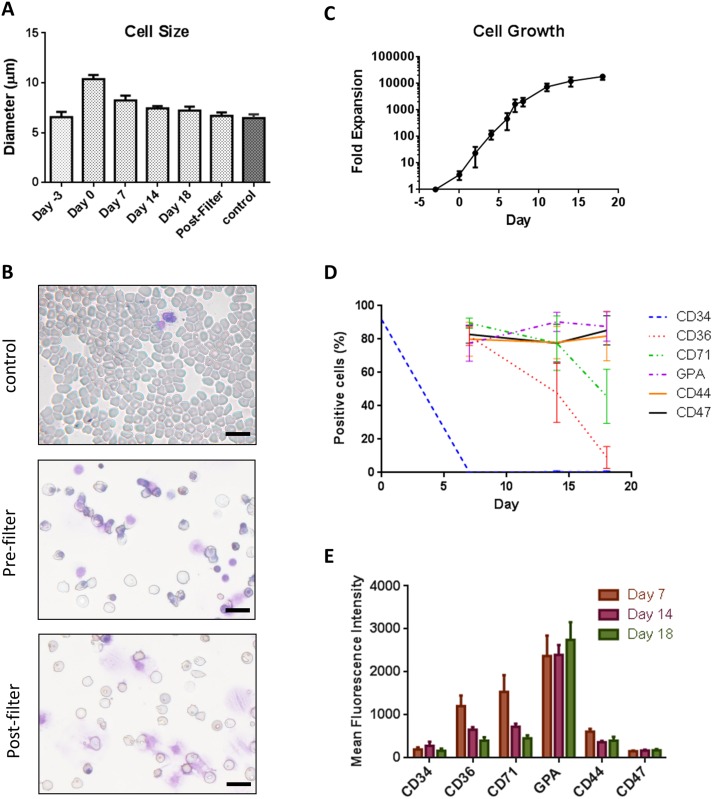
Fig 1. Characterization of stemRBCs.
(A) Cell diameters of stemRBCs (n = 10) derived from cord blood isolated CD34+ cells during differentiation from day 0 to day 18 in culture compared to human control RBCs and filtered cells on day 18. (B) Cell morphology of adult human blood (control) from cytospins for comparison with pre- (NF) and post-filter (F) day 18 stemRBCs. Scale bar represents 20 μm. (C) Total number of viable, non-adherent cells were determined and plotted as a mean ± SE of 4 cultures. (D) Frequency of cells expressing several erythroid markers as determined by flow cytometry over an 18 day culture period (mean ± SE) and (E) mean ± SE fluorescence intensities (MFIs) showing expression patterns of these markers during differentiation (n = 8).

