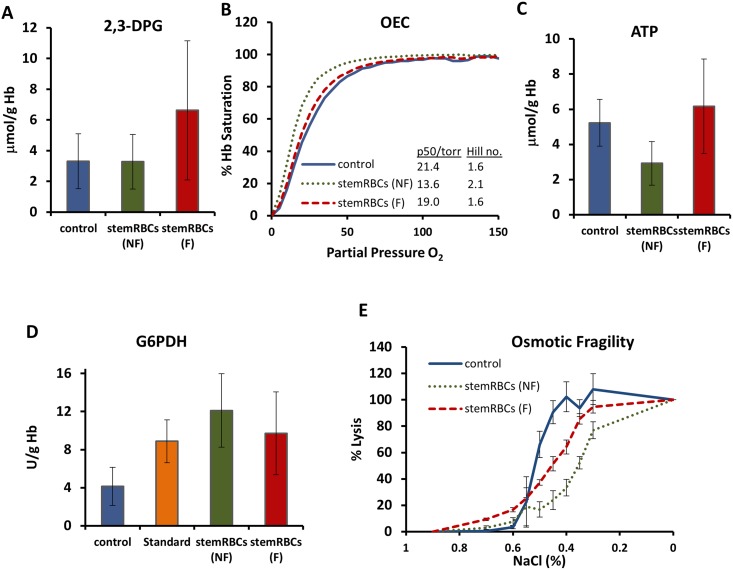
Fig 3. Analysis of biochemical and membrane property parameters.
(A) 2,3-DPG levels in human control RBCs, as well as non-filtered (NF) and filtered (F) stemRBCs harvested on day 18 of culture (n = 3)(mean ± SD). (B) Oxygen binding curves showing filtered (F) and non-filtered (NF) stemRBCs harvested on day 18 of culture and control RBCs (n = 3 each) (mean ± SD). (C) ATP and (D) G6PDH analysis of day 18 non-filtered and filtered stemRBCs (n = 3–5) as well as control and G6PDH standard (n = 8) (mean ± SD). (E) Osmotic fragility of filtered and nonfiltered stemRBCs harvested on day 18 was assessed by exposing them to decreasing amounts of saline and determining the amount of released hemoglobin by colorimetric assay (control RBCs were assessed simultaneously for comparison). Error bars show standard deviation.

