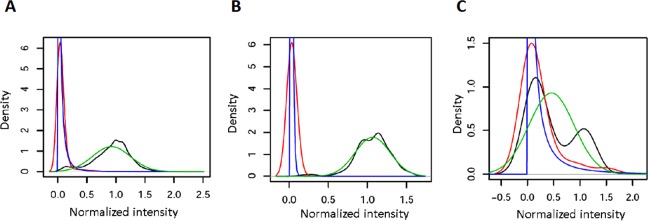
Fig 1. Examples of the density of normalized hybridization signals from the training set and their corresponding distribution functions for positive and negative data.
A) General reference curves; B) Probe-specific curves for probe Y188a, showing no overlap between positive and negative distribution functions. C) Probe-specifc curves for probe M230-3, with high overlap between positive and negative distribution functions (probe discarded during the quality control, see text). The probe-specific curves for the 124 probes that passed the quality control are shown in Figure G in S1 File. Color code: Red, density of normalized negative hybridization signals; Blue, fit of the negative data to a log-normal distribution; Black, density of normalized positive hybridization signals; Green, fit of the positive data to a normal distribution.

