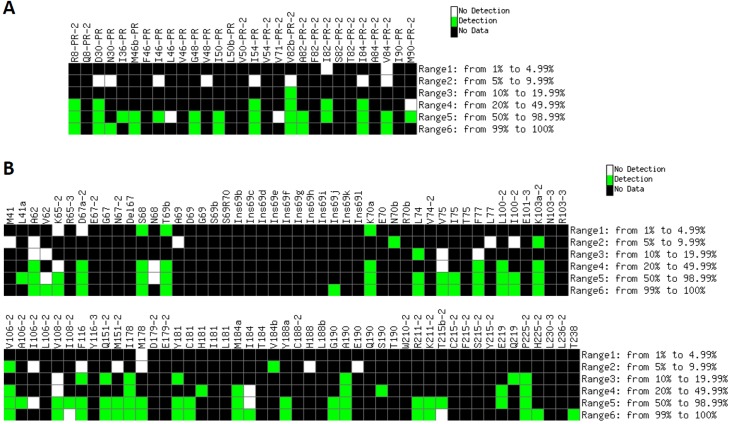
Fig 4. Detection of minority variants in clinical samples by the genotyping microarray.
Columns: probes included in the microarray belonging to the PR (A) and RT (B) regions that passed the stepwise filtering protocol. Color code: Green, hybridization signal produced at the corresponding probe when the complementary target is present within a given rate (shown on the right side of each panel) in the quasispecies; White, lack of detection of an expected signal; Black, no data available (the sequence complementary to the queried codon is not present in any of the clinical samples at the corresponding percentage range).

