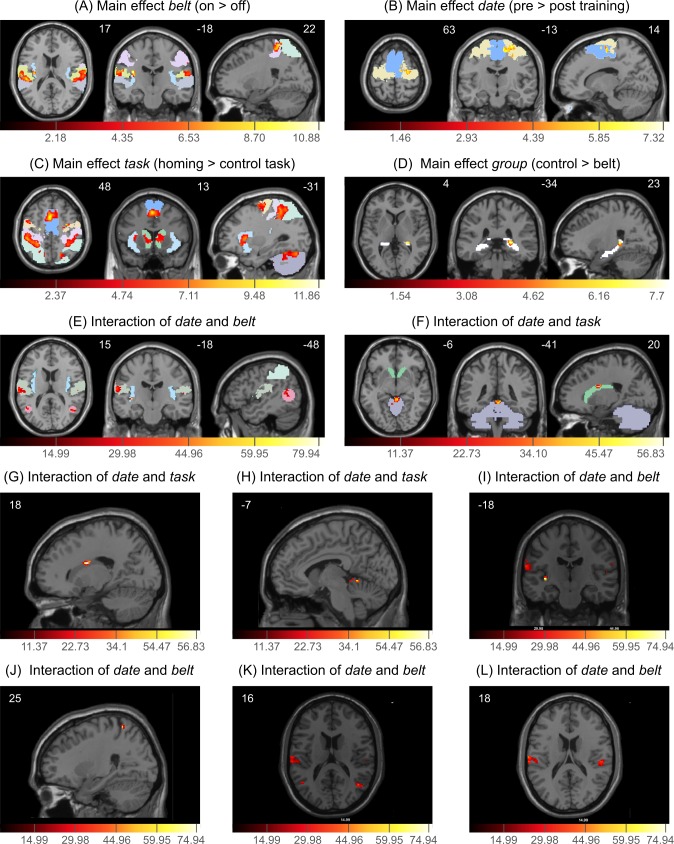
Fig 3. Main effect and 2-way interactions in the fMRI data.
Significant BOLD activation differences (the activation color-coding is depicted below the figures) in ROIs in z-, y-, x-planes (coordinates are depicted on top of each panel). (A) Main effect belt (on > off), (B) Main effect date (pre > post training), (C) Main effect task (homing > control task), (D) Main effect group (control > belt), (E) Interaction of date and belt, (F) Interaction of date and task. Captions color-coding ROIs in Fig 3(A)-(F): S1 lavender, S2 khaki, PPC light green, STG light gray, Insula baby blue, premotor cortex peach, SMA blue, cerebellum dark gray, caudate nucleus forest green, Hippocampus white, MST pink. (G-L) Blown ups of planes best depicting peak activations in ROIS of significant BOLD activation differences in two-way interactions: (G) Interaction date x task, peak activation of caudate nucleus, (H) Interaction date x task, peak activation of Cerebellum, (I) Interaction date x belt, peak activation of insula, (J) Interaction date x belt, peak activation of PPC, (K) Interaction date x belt, peak activation of MST, (L) Interaction date x belt, peak activation of S2, (S2 also depicted in I and K).

