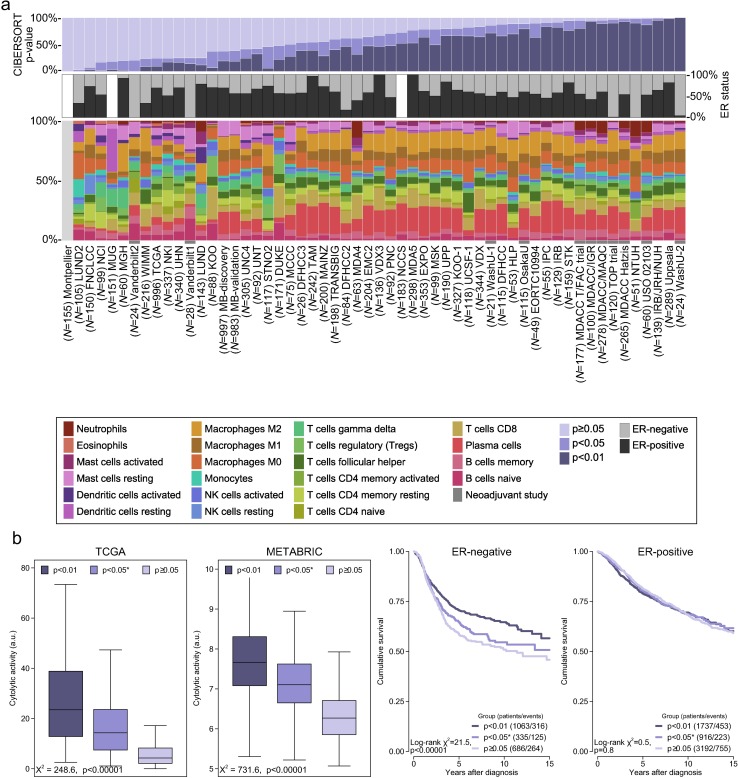
Fig 2. Summary of inferred immune cell subsets by study.
(A) Bar charts summarising immune cell subset proportions against ER status and CIBERSORT p-value by study. (B) Box plots depicting the association between immune cytolytic activity and CIBERSORT p-value (outliers are not shown; depicted chi-squared statistics and p-values are from Kruskal-Wallis tests); survival plots of groups defined by CIBERSORT p-value separately by ER status (depicted chi-squared statistics and p-values are from log-rank tests). *0.01 ≤ p < 0.05. a.u., arbitrary units; ER, oestrogen receptor; NK cells, natural killer cells; TGCA, The Cancer Genome Atlas.

