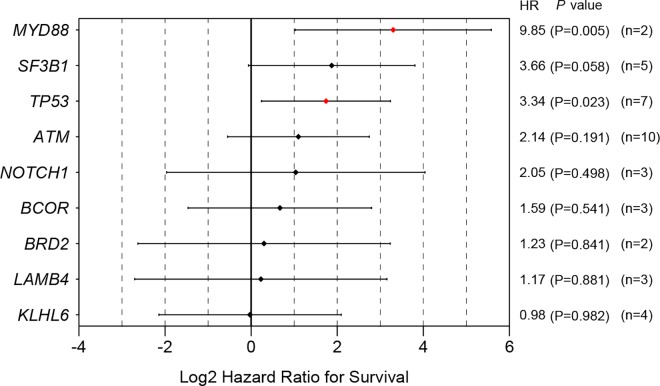
Fig 11. Hazard ratios with 95% confidence intervals for overall survival for each gene variant.
Data of gene mutations which are shown only in one patient are not shown. Raw P-values are shown in this figure. After applying FDR for multiple comparison, MYD88 mutation is the only statistically significant gene which had high hazard ratio (P = 0.045).

