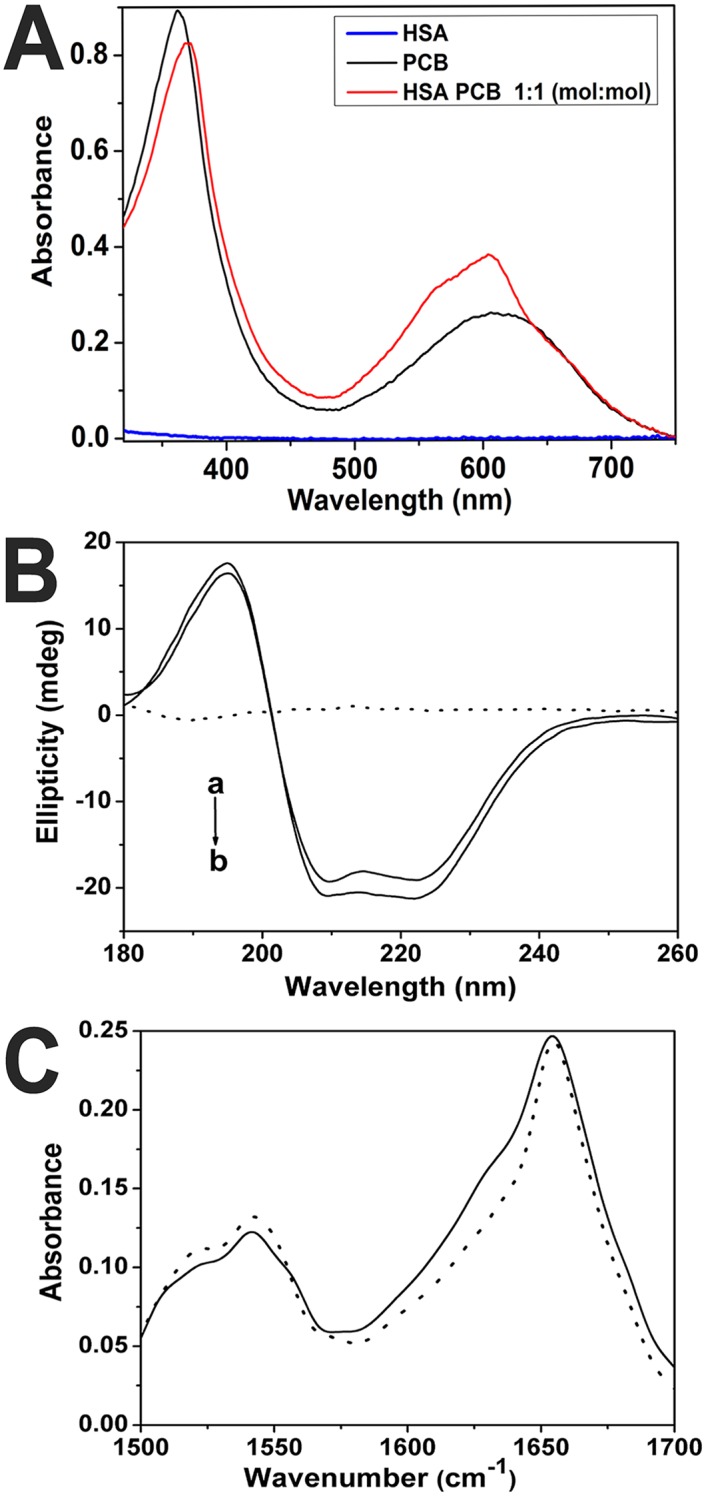
Fig 4.

(A) UV-VIS spectra of free HSA, free PCB, and HSA-PCB complex (molar ratio 1:1); (B) Far-UV circular dichroism spectra of HSA in the absence (a) and presence (b) of PCB. Dot line curve shows spectrum of PCB; (C) The FT-IR spectra of free HSA (solid line), and the FT-IR difference spectra of HSA-PCB complex (molar ratio 1:1) (dot line). All spectra were recorded in 20 mM Tris buffer (pH 7.4) with samples of 18 μM HSA and 18 μM PCB.
