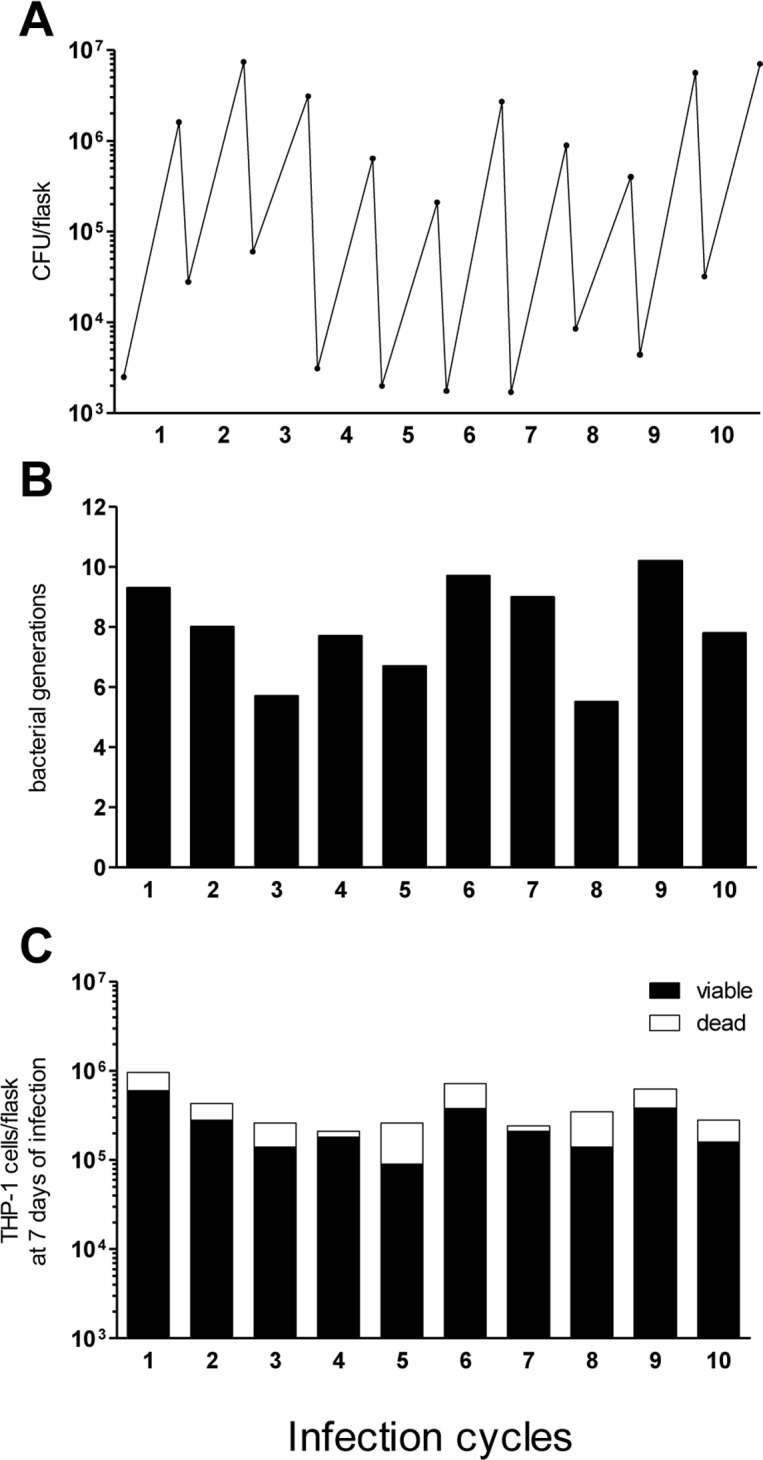
Fig 2. Parameters of the continuous intracellular culture model.

THP-1 cells were infected with M. tuberculosis H37RvSiena strain for 10 serial infection cycles. The graphs show the parameters evaluated for each cycle. (A) Bacterial CFU count. Bacterial CFU at day 1 and day 7 of infection. (B) Intracellular generations. Number of bacterial generations per cycle, calculated by using the formula (log2 CFU day 7- log2 CFU day 1)/log2 2. (C) Count of infected THP-1 cells. Number of total, viable adherent THP-1 cells (black bar), and dead cells (white bar) at day 7 of infection.
