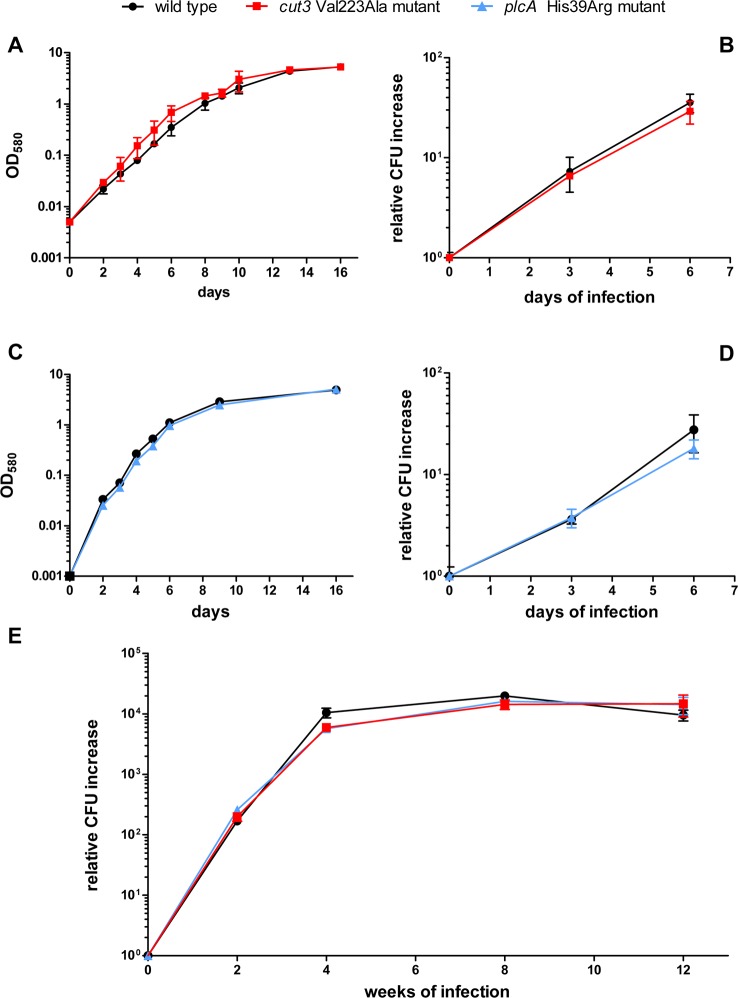
Fig 3. Growth curves of wild type, cut3 Val223Ala and plcA His39Arg mutant strains in liquid medium, THP-1 cells and murine lung.
(A and C) Growth curves in liquid medium. Growth curves in liquid medium over 16 days of incubation for cut3 Val223Ala mutant (A) and plcA His39Arg mutant (C) strains. (B and D) Growth curves in THP-1 cells. Growth curves of cut3 Val223Ala mutant (B) and plcA His39Arg mutant (D) strains in THP-1 cells over 6 days of infection. Data are expressed as CFU increase relative to day 0. (E) Growth curves in murine lung. Growth curves of wild type, cut3 Val223Ala mutant, and plcA His39Arg mutant strains in the murine lung up to 12 weeks post-infection. Panels A-D show the mean and standard deviation of results obtained from three replicates; panel E shows the mean and standard deviation of results obtained from 3–4 animals per time point.

