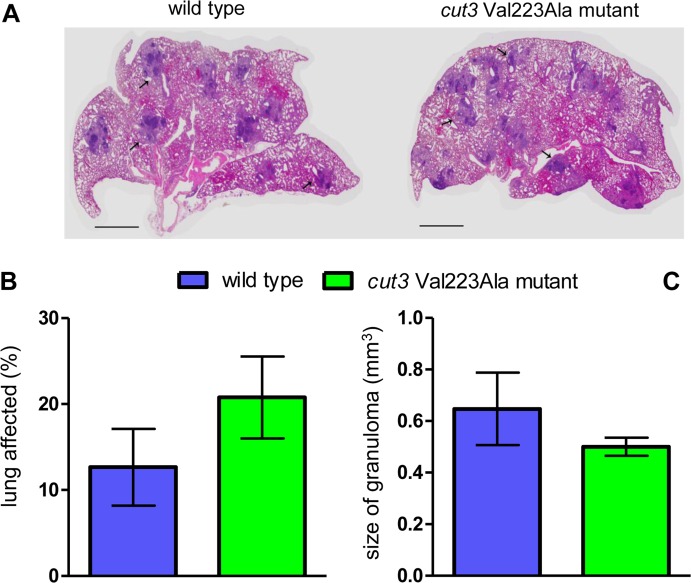
Fig 4. Morphometric analysis of mouse lungs infected with wild type and cut3 Val223Ala mutant strains at 12 weeks of infection.
(A) Representative image of mouse lung sections. The image represents 4× magnification of lung sections stained with hematoxylin and eosin. Arrows indicate granulomatous lesions. Scale = 1mm. (B-C) Proportion of involved lung and granuloma size. The graphs show the proportion of lung parenchyma occupied by granulomas (B) and the size of granulomas (C). Results represent the mean and standard deviation of data collected from 3 mice per infecting bacterial strain.

