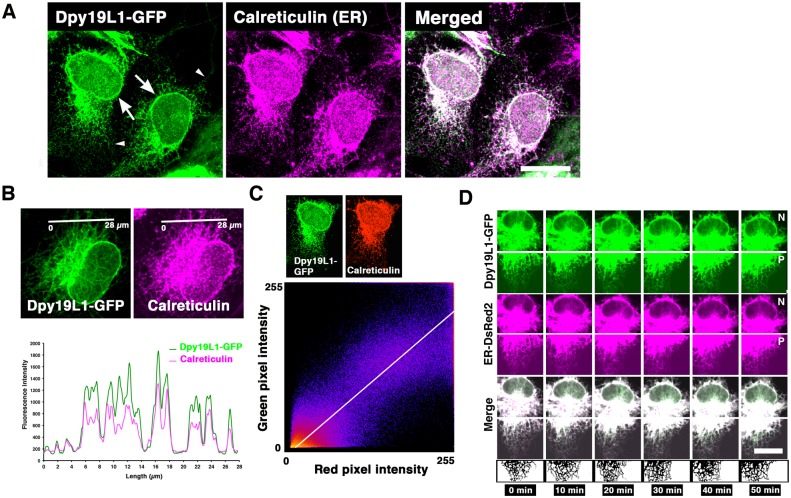
Fig 1. Endoplasmic reticulum (ER) localization of Dpy19L1 in COS-7 cells.
COS-7 cells were transfected with a Dpy19L1-GFP plasmid. After 24 h, the subcellular localization of Dpy19L1 was observed by immunofluorescence for GFP and Calreticulin, a marker for the ER. (A) Confocal images of Dpy19L1-GFP (green) and Calreticulin (magenta). Right panel is the merged image. Dpy19L1-GFP shows a similar pattern with Calreticulin. Arrows indicate localization of Dpy19L1 around the nucleus. (B) Double staining of Dpy19L1 and Calreticulin. Lower image indicates intensity profile analysis along a white line in the upper images. (C) Colocalization analysis. An example of scatter plot of red and green pixel intensities of the Dpy19L1-GFP/Calreticulin double-labeled cell shown in Fig 1A. Intensities were measured from fifteen COS-7 cells. (D) Dynamics of Dpy19L1 and the ER were observed by time-lapse imaging. The movies are shown in S1 and S2 Movies. COS-7 cells were transfected with a Dpy19L1-GFP plasmid together with pER-DsRed2. Upper and lower images show perinuclear (N) and peripheral (P) regions, respectively. Time-lapse images were recorded from twenty-five COS-7 cells. Results shown are representative of at least three independent culture experiments. Scale bars: 20 μm in A and C.

