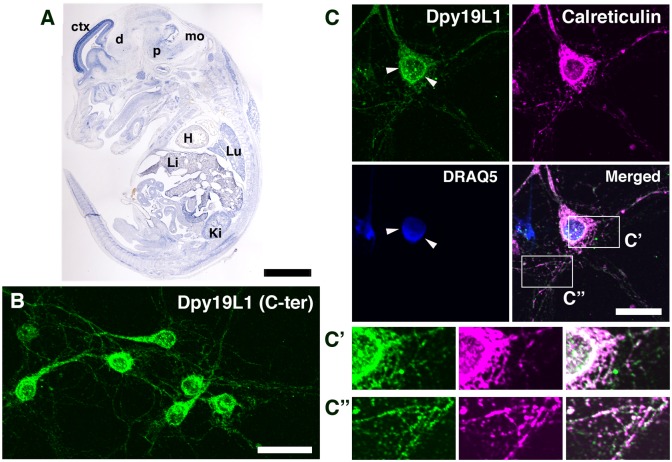
Fig 3. Dpy19L1 distribution in embryonic cortical neurons.
(A) Expression of Dpy19L1 mRNA visualized by ISH on sagittal section of E14.5 mouse embryo. ctx, cerebral cortex; d, diencephalon; p, pons; mo, medulla oblongata; H, heart; Lu, lung; Li, liver; Ki; kidney. (B) Primary neurons were prepared from the E14.5 mouse cerebral cortex and cultured for 5 days. The distribution of Dpy19L1 was observed by immunostaining with anti-Dpy19L1 antibody (C-ter). (C) Double immunostaining for Dpy19L1 (green) and Calreticulin (magenta). Nucleus was labeled by DRAQ5 (blue). Lower right panel shows the merged image. Dpy19L1 is partially colocalized with the ER marker Calreticulin. Arrowheads show Dpy19L1 distribution around the nucleus. C′ and C″ show magnified images of boxed areas. Results shown were obtained from three independent cultures. Scale bars: 200 μm in A, 30 μm in B, and 20 μm in C.

