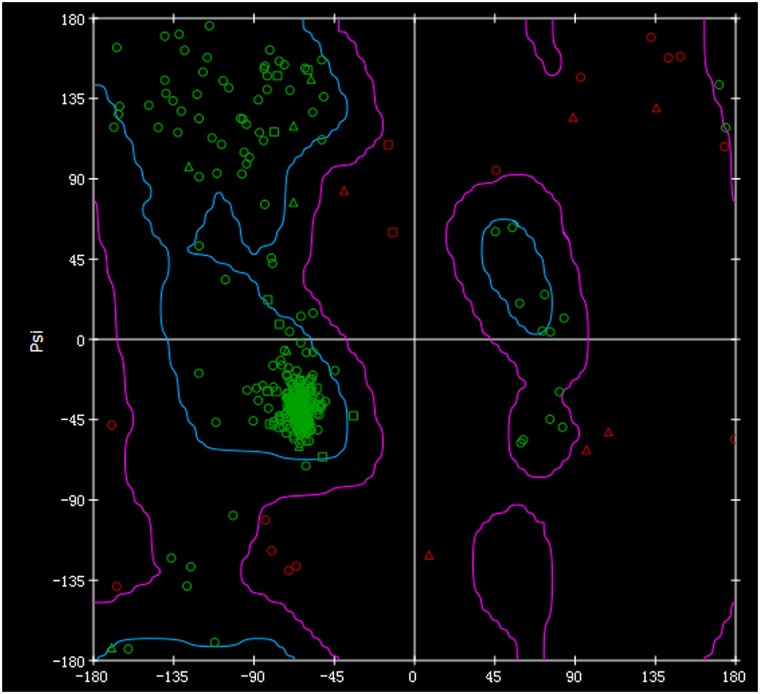
Fig 4. Ramachandran plots for the modeled 3D structures of AmpG from PAO1.
The Ramachandran plot indicates low energy conformations for φ (phi) and ψ (psi). The conventional terms are used to represent the torsion angles on either side of the alpha carbons in the peptides. A triangle indicates glycine, a square indicates proline and all other types of amino acids are indicated as circles. The regions circled with gray lines represent the most favorable combinations of phi-psi values.

