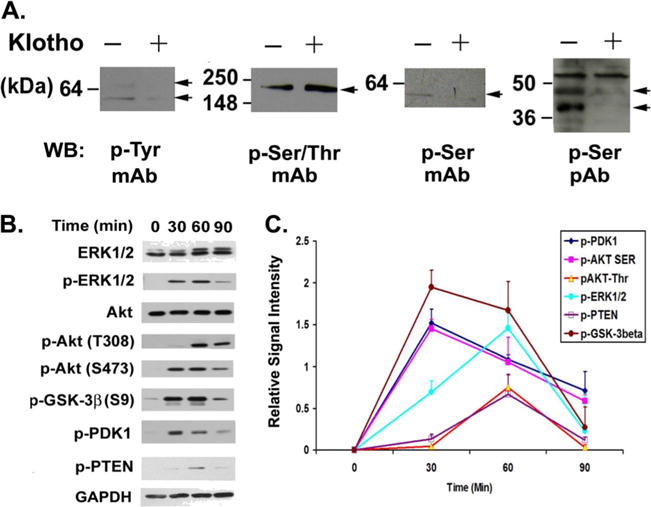
Fig. 1.

Phosphorylation kinetic analysis of Klotho-treated MO3.13 cells shows involvement of ERK and AKT pathways. A Protein phosphorylation analysis of Klotho-treated MO3.13 cells. MO3.13 cells were treated with Klotho for 2.5 h and the cell lysates were analyzed by SDS-PAGE and western blotting for protein phosphorylation using the indicated monoclonal or polyclonal antibodies against phosphorylated tyrosine (p-Tyr), serine/threonine (p-Ser/Thr), or serine (p-Ser) with (+) or without (−) Klotho treatment. B MO3.13 cells were treated with Klotho for the durations indicated and the cell lysates were analyzed by SDS-PAGE and western blotting for protein phosphorylation of the indicated proteins. C Densitometry of the kinetics of the signal intensity of the bands in A. Results are the average of three to five independent experiments. Error bars indicate standard deviation
