
Fig. 6.
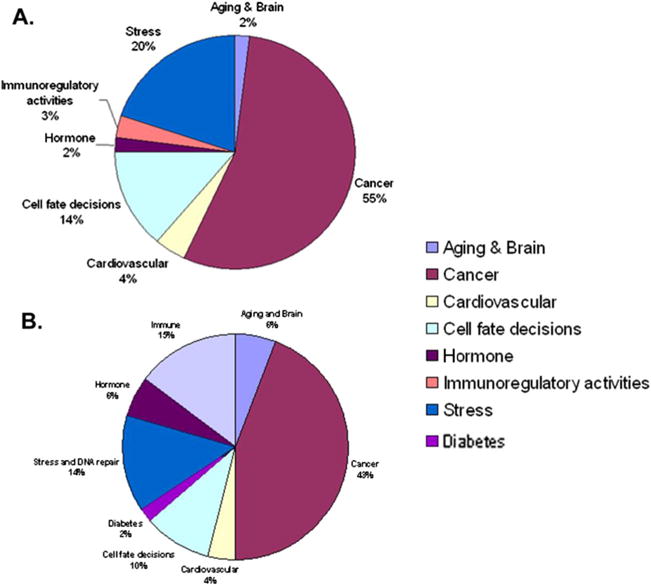
Comparison of microarray data from Klotho-treated MO3.13 cells with chemical and genetic perturbation database (CGP). CGP gene sets enrichment analysis was applied on the significant differential signature genes from the Klotho-treated MO3.13 cells compared to the molecular signature database from the Broad Institute. The top 100 “hits” from the comparison of the upregulated genes (a) and downregulated genes (b) were categorized, and the frequency of each category was plotted. The results of the comparison of the upregulated and downregulated genes with CGP database are shown in Tables 2 and 3 in the Supplemental material