
Figure 2.
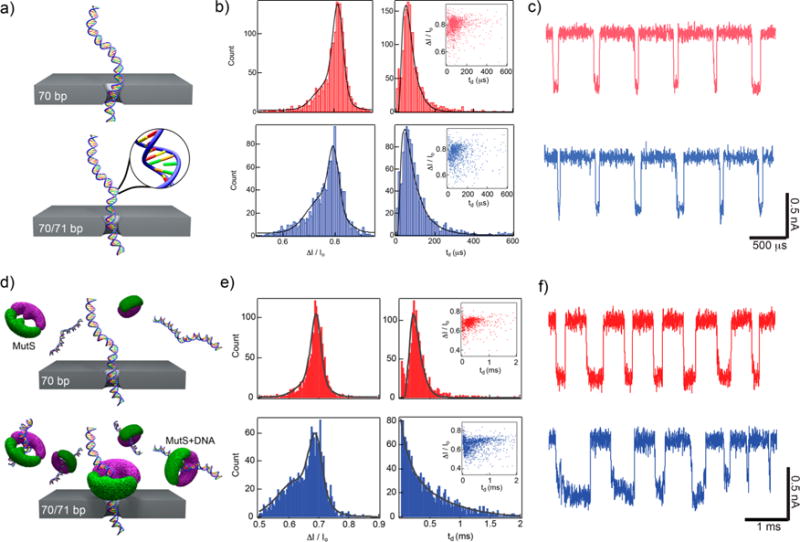
Single mismatch detection using nanopores. (a) Schematics of two different DNA molecules translocating a nanopore: a homologous 70 bp DNA and a 70/71 bp DNA that contains a single base mismatch at the center. (b) Fractional current blockade ΔI/Io and dwell time td histograms for transport through a 2.4 nm diameter nanopore at 200 mV. Insets: Scatter plots of ΔI/Io vs td show similar translocation populations for the two samples. (c) Concatenated, consecutive events of each analyte further demonstrates difficulty detecting the single mismatch (traces low-pass filtered at 200 kHz). (d) Illustration of each sample passing through a 2.6 nm pore after incubation with mismatch-binding protein MutS. (e) Histograms of current blockade (both fit to a double Gaussian model) show a clear shoulder develops at a lower current blockade in the 70/71 bp DNA when incubated with MutS. In addition, the dwell time histogram for 70/71 bp has a drastically different shape than that for 70 bp, indicating an altered transport process (fit using a single exponential function). Insets: Scatter plots of each sample show an increase in longer dwell time events in 70/71 bp, suggesting stripping of MutS during translocation. (f) Concatenated, consecutive events for each analyte exemplify differences between two samples (traces low-pass filtered at 200 kHz).