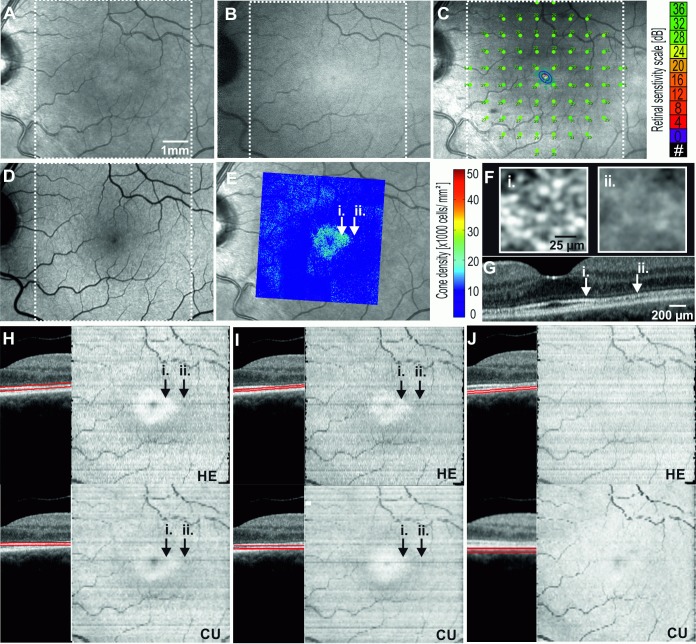
Fig 6. Multimodal imaging showing the left eye of Case 3: early hydroxychloroquine toxicity.
20° × 20° Near-infrared reflectance NIR (A) reveals a subtle hyper-reflective foveal signal while infrared autofluorescence IRAF (B), microperimetry (C) and blue-light autofluorescence BAF (D) are within normal limits. Adaptive optics flood illumination ophthalmoscopy AO-FIO density map overlaid on NIR (E) and cone image (F) reveals a transition zone in the parafovea where cone reflexes are lost (E). OCT B-scan (G) through the foveal center demonstrates preserved (i.) and attenuated (ii.) interdigitation zone at parafovea. The en face OCT image reveals a para- and perifoveal concentric zone of reduced reflectivity from the ellipsoid zone EZ (H) and the interdigitation zone IZ (I). Retinal pigment epithelium RPE layer en face OCT appeared normal (J). In this case, HE is able to accurately identify the contour of Bruch’s membrane and hence the en face OCT images are similar to the one generated by our custom software (CU). White dotted square corresponds to region for which en face maps are generated.

