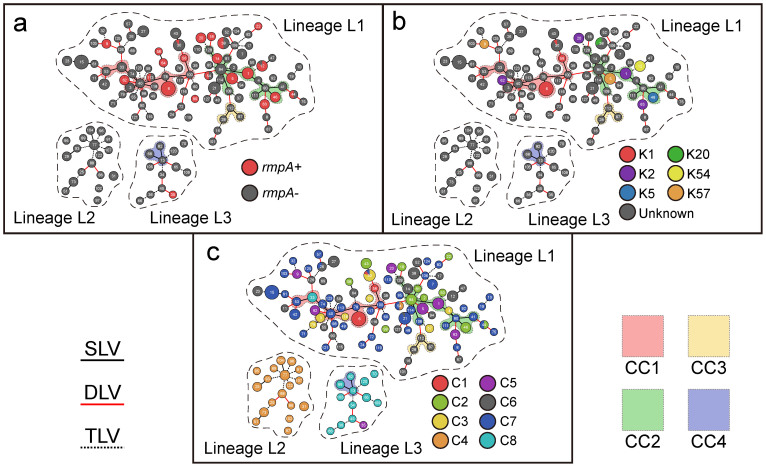
Figure 3. MS tree.
The MS tree of the 128 STs was inferred by Phyloviz on the basis of allelic profiles. Each circle indicated a ST (node), and a larger size of the circle corresponded to a larger number of strains included. The edge between STs represented the relationships of SLV (black and solid), DLV (red and solid) and TLV (black and dash), and a thicker edge corresponded to a shorter phylogenic distance. The dash lines separated three lineages L1 to L3. The background colors indicated different CCs. The prevalence of rmpA (a), capcular serotypes K1, K2, K5, K20, K54, K57 (b) and LVPC complexes C1 to C8 (c) were highlighted with different colors.

