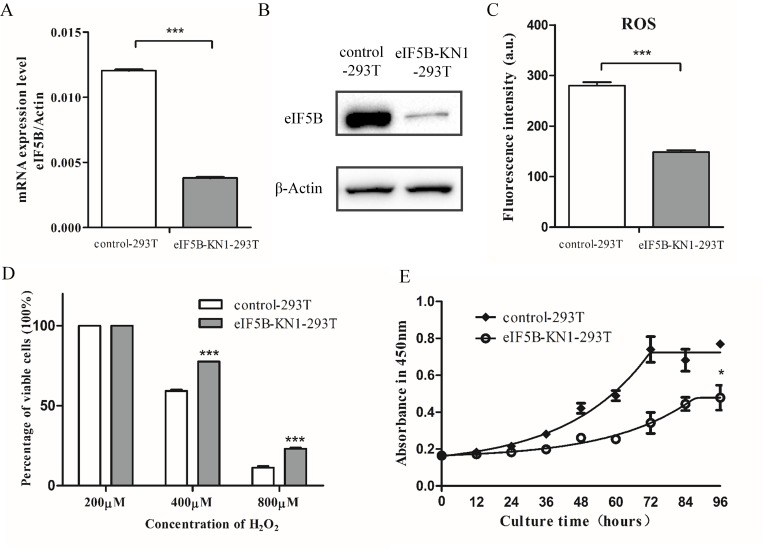
Fig 1. Characterization of eIF5B-KN1-293T and control cells.
(A) Semi-quantitative RT-PCR analysis of eIF5B mRNA levels; (B) Western blot analysis of eIF5B protein expression; (C) Cellular ROS levels; (D) Survival rates of cells treated with different concentrations of H2O2 for 12 h, as determined by trypan blue dye exclusion assay; and (E) Cell growth curves. Data are presented as the mean and standard deviation (*p<0.05; **p<0.01; ***p<0.001; n = 3).

