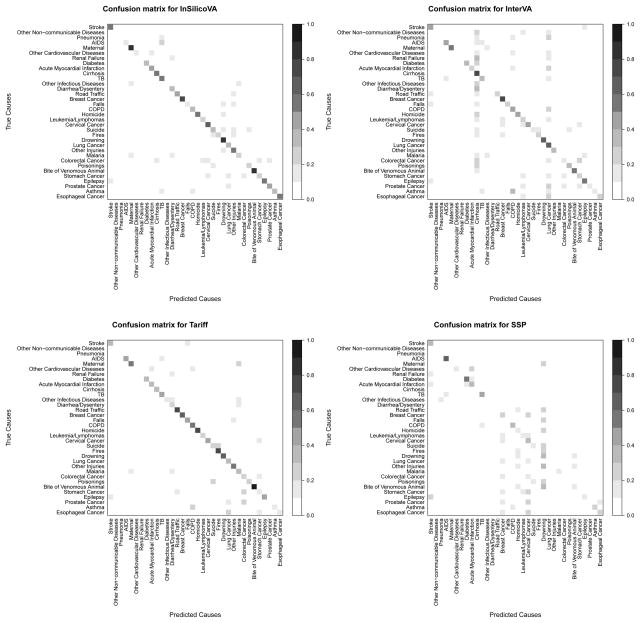
Figure 3. Confusion matrices.
Confusion matrix for four methods, with InSilicoVA and InterVA using the default prior. Shading on the diagonal represents the fraction of correct classifications across 100 test-train splits using the Dirichlet resampling strategy; Off-diagional shading represents the fraction of misclassifcations.

