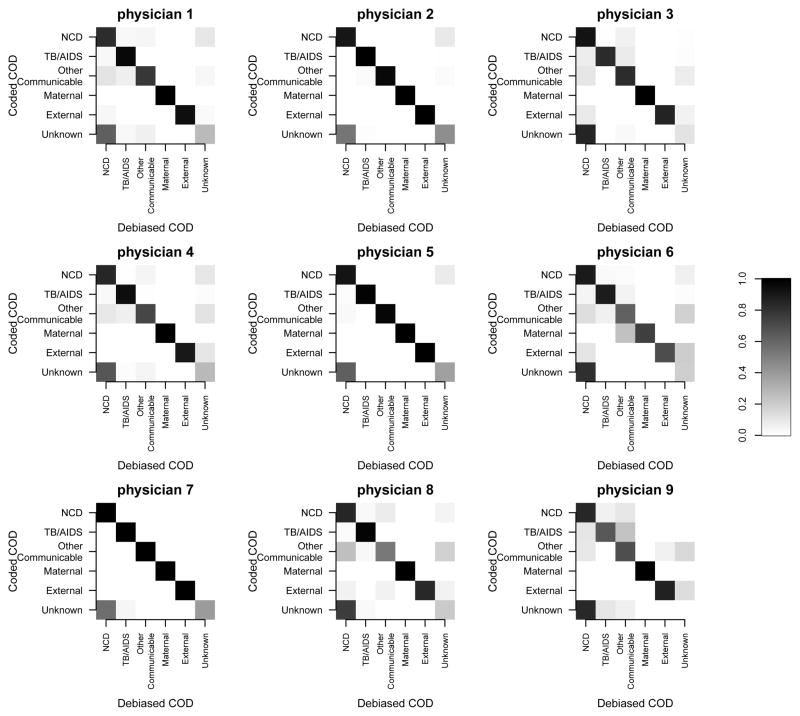
Figure 6. Physician variability.
Each 6 × 6 square matrix represents a single physician coding verbal autopsy deaths from the Karonga HDSS. Within each matrix, the shading of each cell corresponds to the propensity of the physician to classify the death into the cause category associated with the cell’s row when the the true cause category is the one associated with the cell’s column. The physician bias estimates come from comparing cause assignments for the same death produced by multiple physicians. A physician with no individual bias would have solid black on the diagonal. The figure indicates that the variation in both the nature and magnitude of individual physician bias varies substantially between physicians.

