Figure 3.
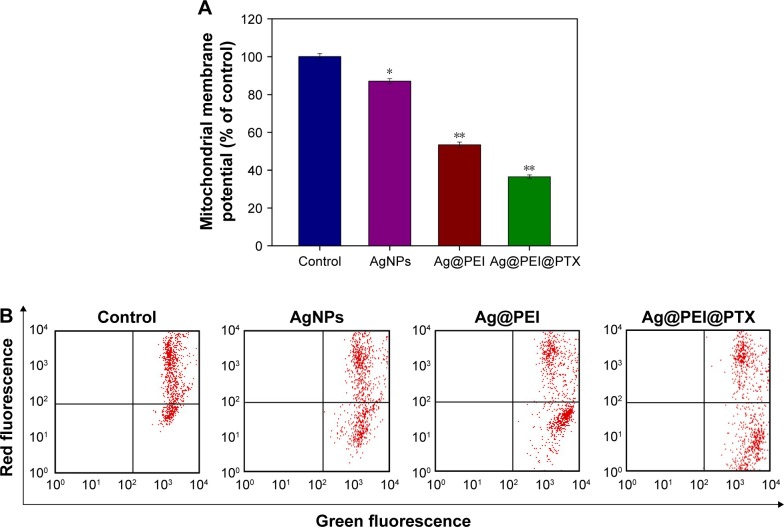
Depletion of mitochondrial membrane potential induced by AgNPs, Ag@PEI, and Ag@PEI@PTX.
Notes: (A) The percentage of mitochondrial membrane potential. (B) Mitochondrial membrane potential of HepG2 exposed to AgNPs, Ag@PEI, and Ag@PEI@PTX. Bars with different characters are statistically different at P<0.05 (*) or P<0.01 (**) level.
Abbreviations: AgNPs, silver nanoparticles; PEI, polyethylenimine; PTX, paclitaxel.

